Test Results Analysis Report
This document lists features of the Test Results Analysis Report.

The Test Results Analysis Report provides insights into test execution trends, anomalies, and stability across builds, sprints, and releases. It enables QA teams to monitor testing performance over time, identify regressions, and support data-driven release decisions in Katalon True Platform.
Tutorials:
Report Features
The Test Results Analysis Report aggregates execution outcomes across selected time intervals (daily, weekly, or monthly) and dimensions (e.g., project, release, tester, or platform).
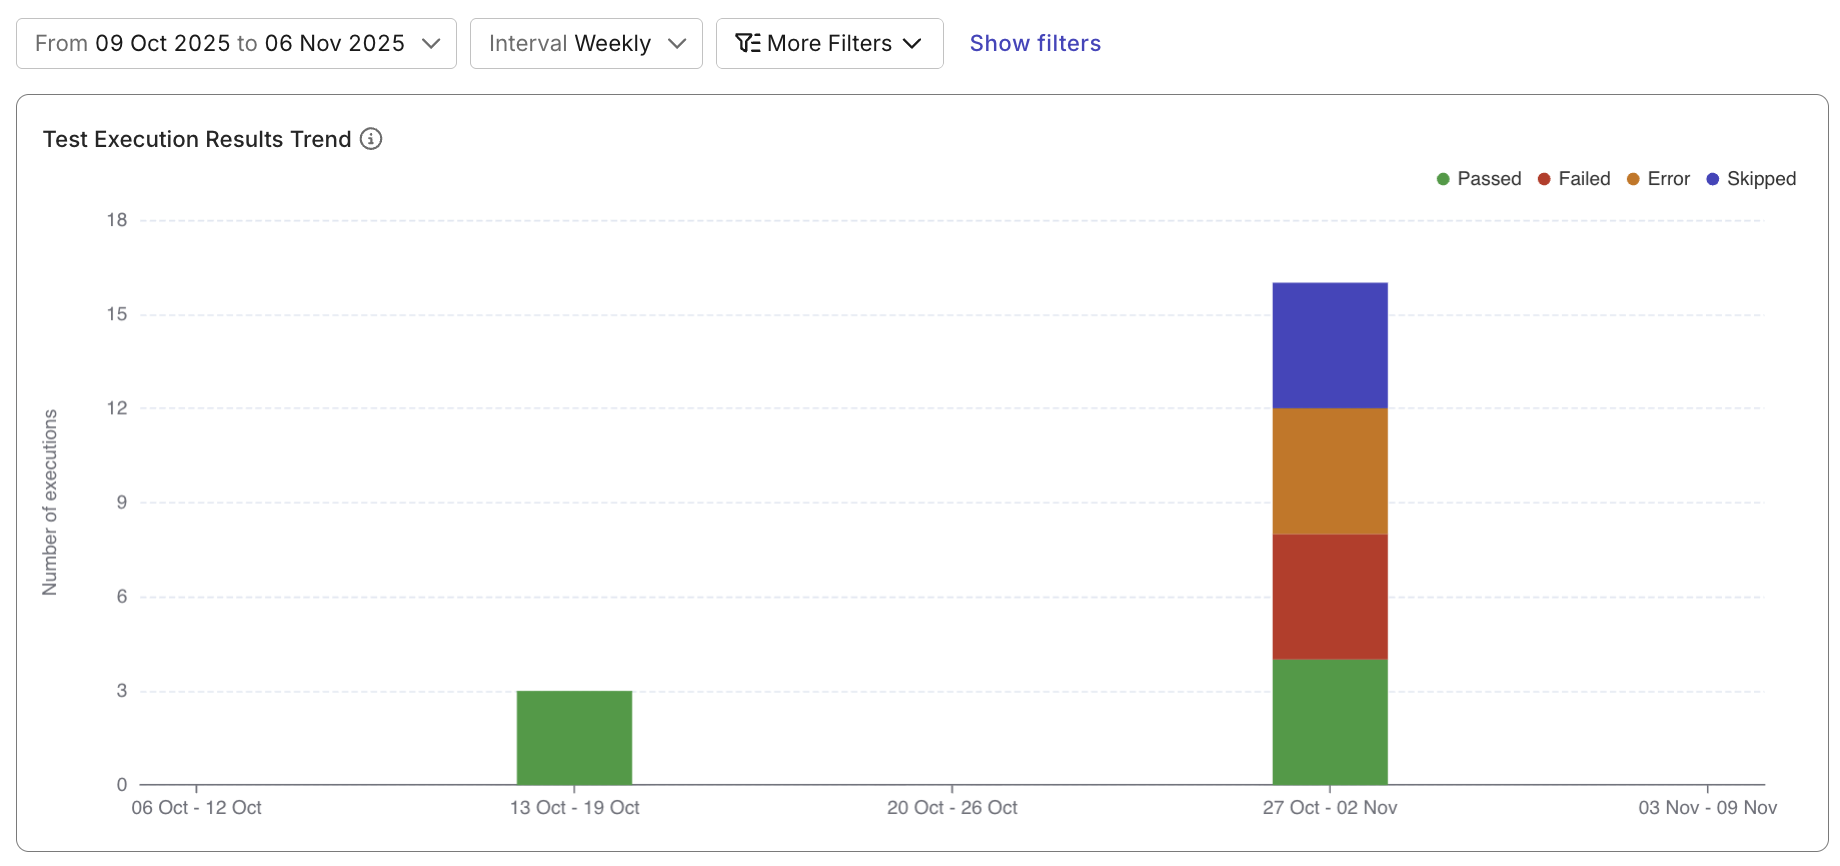
Test Execution Results Trend widget
A stacked bar chart showing how test statuses (Passed, Failed, Blocked, etc.) evolve across daily, weekly, or monthly intervals.
Use this chart to track whether test performance is improving, degrading, or fluctuating across releases.
Test Execution Results Distribution widget
Displays the proportion of each test result type (Passed, Failed, Skipped, Blocked, Error) in a pie chart.
This provides a quick snapshot of testing health during the selected period.
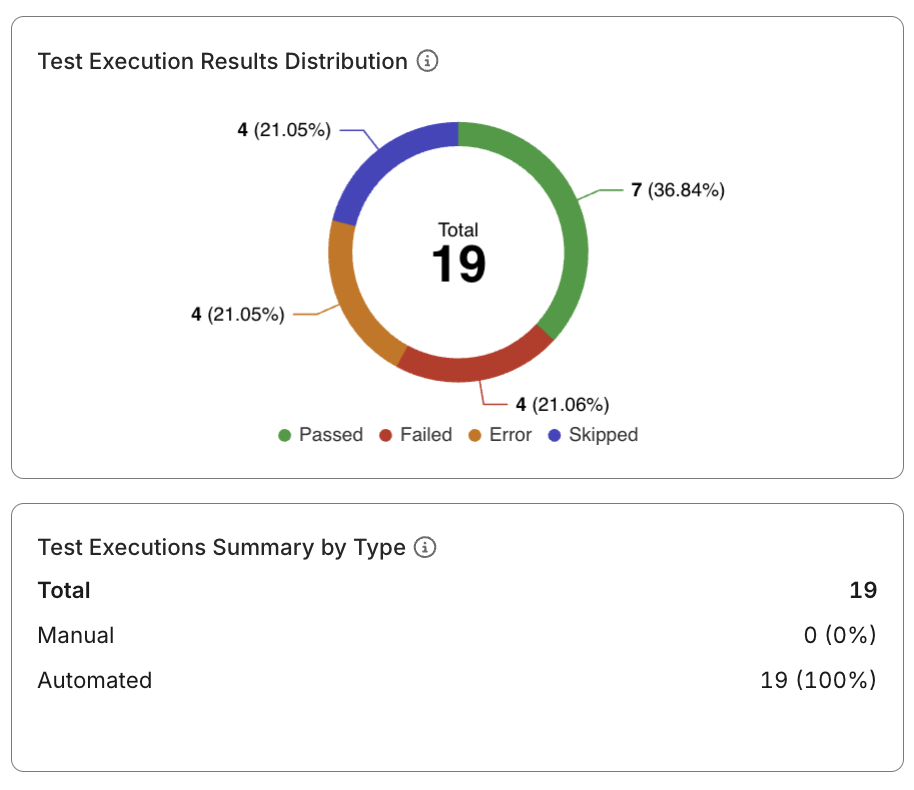
Test Executions Summary by Type
A table that compares result trends between manual and automated executions.
Use this comparison to pinpoint whether stability issues are concentrated in specific test execution types or automation frameworks.
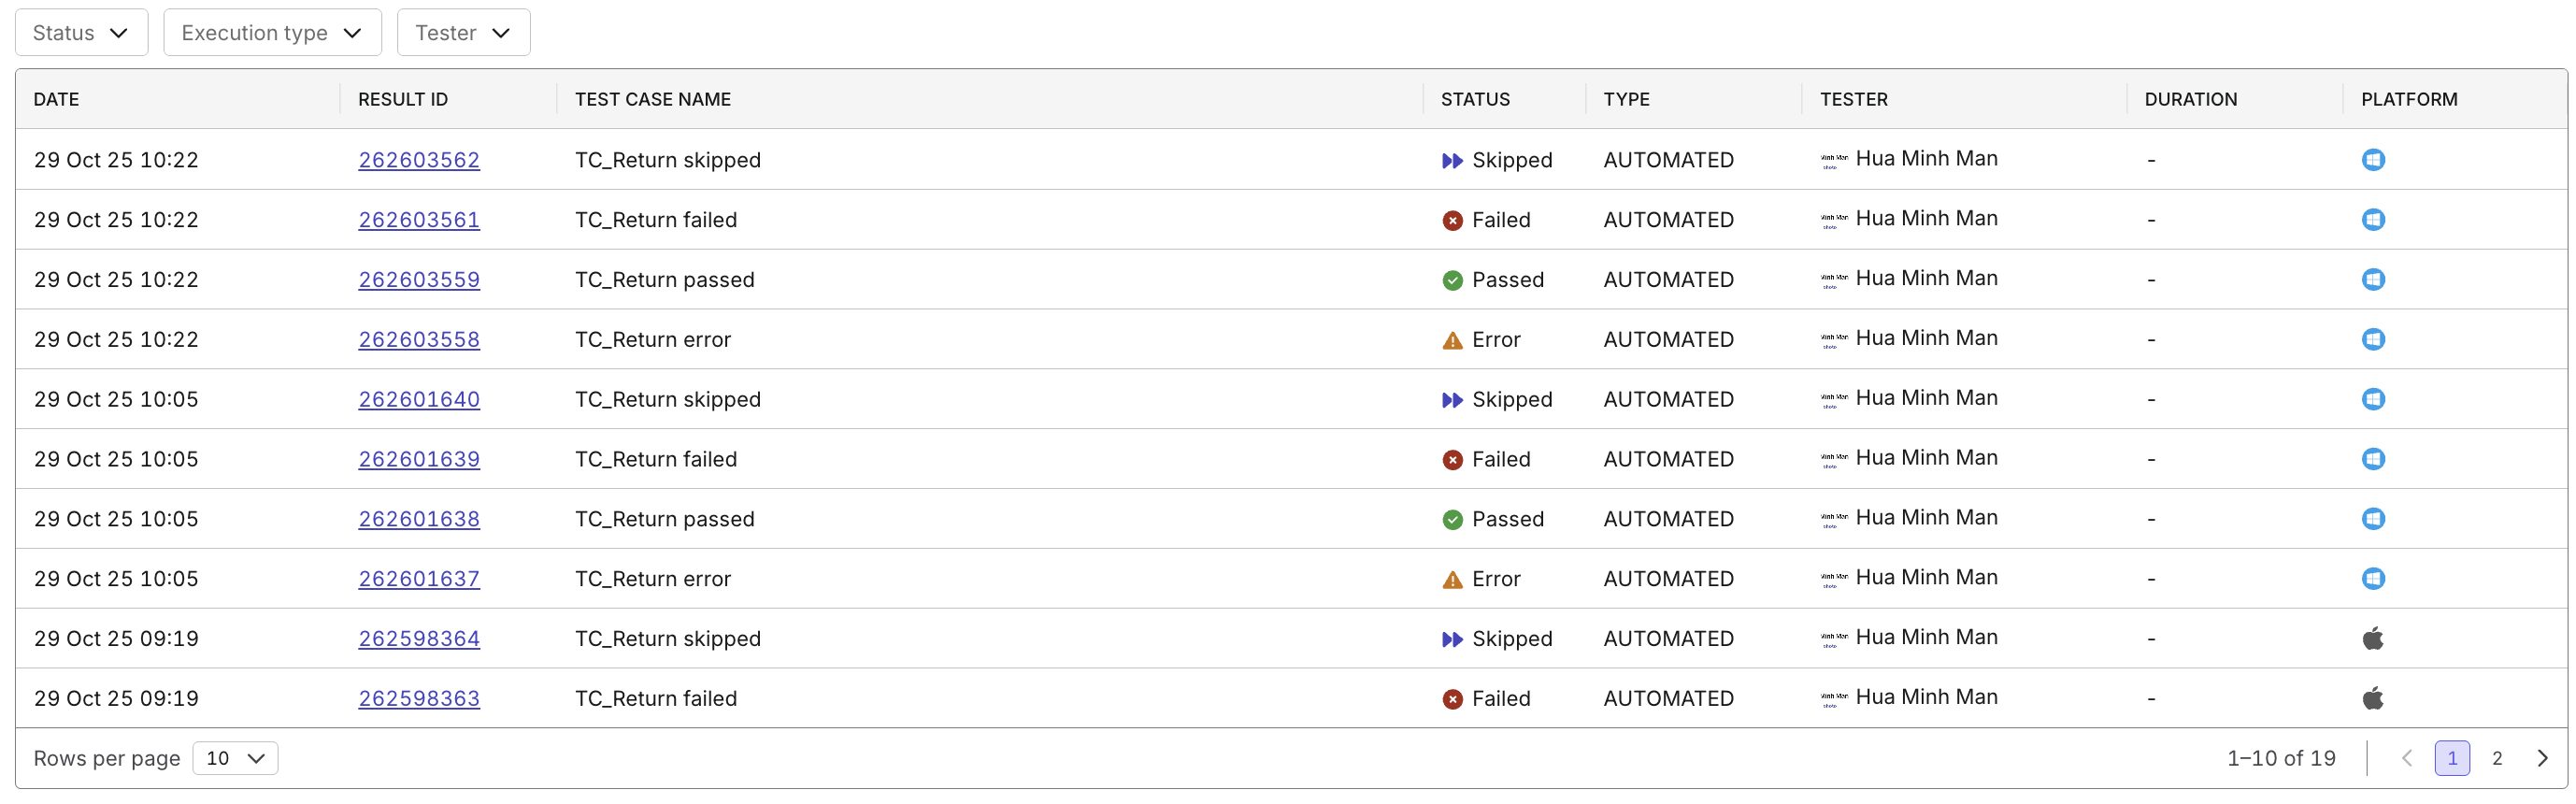
Execution Detail Table
A sortable and filterable table listing test cases, their latest statuses, and historical execution results.
Clicking a test case lets you review its trend, recent runs, and failure causes.
Advanced Filters
Use filters to focus the analysis on specific test scopes or contributors.
Available filters include:
- Time Period / Interval (Daily, Weekly, Monthly)
- Tester / Executor
- Execution Type (Manual or Automated)
- Platform / Configuration
- Release or Sprint
💡 Filters help isolate flaky tests, environment-specific issues, or unstable test types for faster root-cause analysis.
Best Practices for Using the Report
- Use weekly or sprint-based intervals to identify meaningful trends and regressions.
- Apply filters to isolate flaky tests, unstable platforms, or specific testers.
- Track failure rate reduction over time as a KPI for automation health.
- Review anomalies regularly to prevent quality decay.
- Export and present trend insights during release retrospectives or QA dashboards.