Overview
This document explains what problems you could solve with the Analytics module.
If you are new to Katalon True Platform but already have existing executions, upload your existing test reports first so you can start to analyze your project's historical data right away. See Upload test reports for more details.
Overview
The Analytics module in Katalon True Platform helps your team understand test execution health, investigate failures faster, and communicate quality trends with confidence. It brings together dashboards, reports, filters, and AI-powered insights so you can move between a high-level status check and detailed analysis in one place.
Instead of manually collecting metrics from multiple tools, Katalon True Platform consolidates data from connected ALM and CI/CD systems into a unified project view. This helps you answer questions such as:
- Which test suites, environments, or requirements need attention right now?
- Where are the recurring failures, defect bottlenecks, or coverage gaps?
- How is quality changing over time, across releases, or within a sprint?
- Which teams, authors, or execution types contribute most to the current trend?
- How can stakeholders review and share the same quality data without building manual reports?
Use case highlights
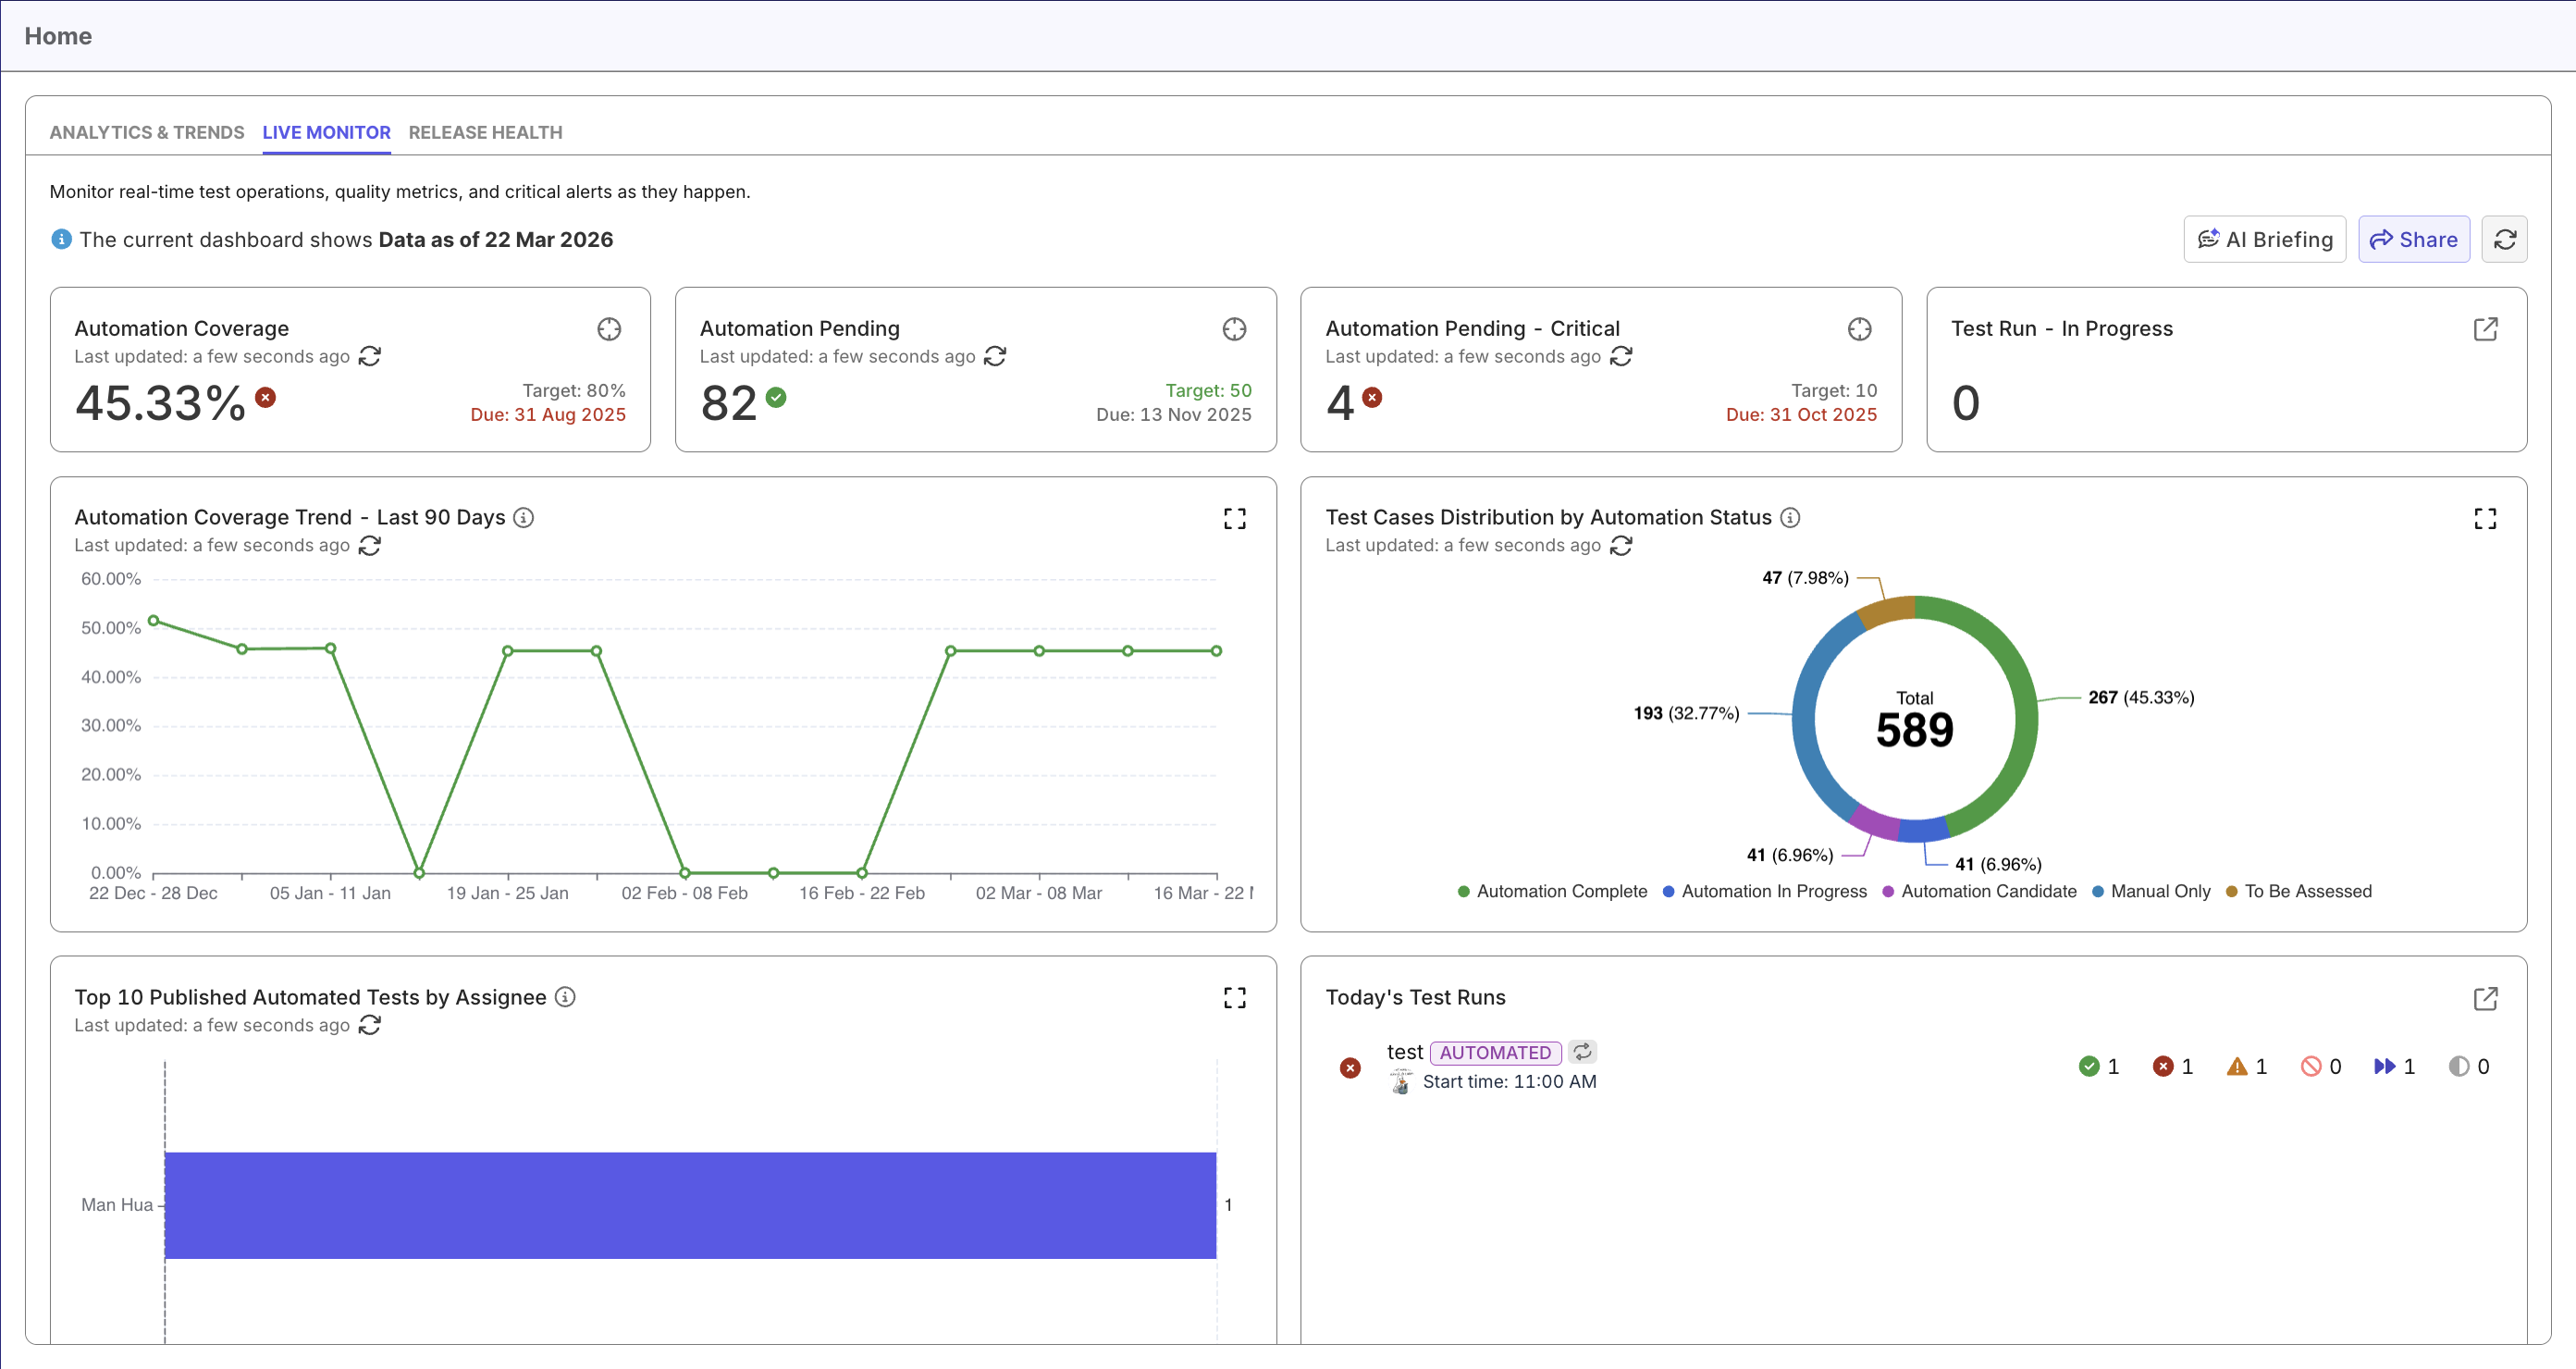
Monitor daily test execution health
View our Live Monitor Dashboard for real-time signals, then drill into specific reports such as Test Case Status Analysis Report, Test Results Analysis Report, and Test Runs Analysis Report to confirm execution status, outcome trends, and run stability.
Assess release or sprint readiness
Check the project's readiness status on Release Health Dashboard for release signals, then expand into individual reports on requirement coverage, execution pass rate, blocking defects, and configuration coverage for validation.
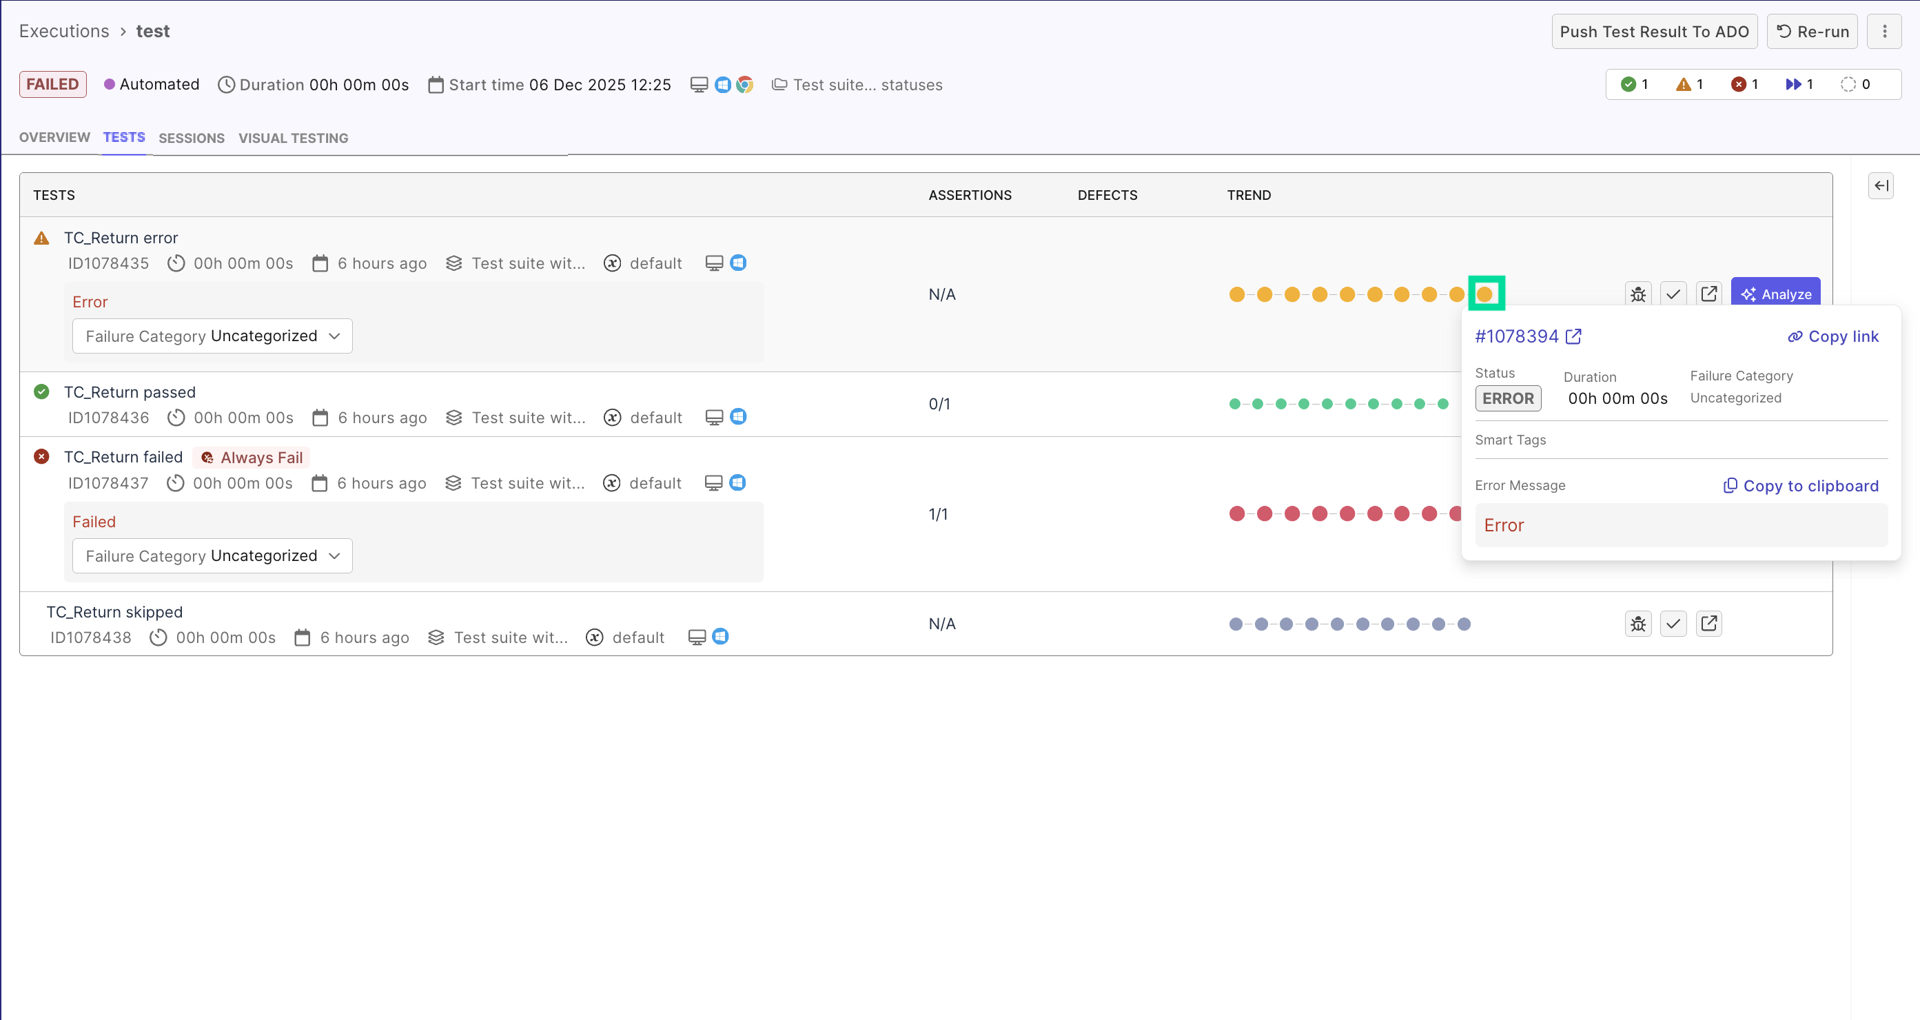
Investigate recurring failures and flaky tests
Begins by viewing a failed test result details, have AI analyze the result for initial triage, then move into separate reports to investigate the failure or flaky tests.
View trends in quality and team activity
Start with the Analytics & Trends Dashboard to review execution, defect, and activity trends across your project, then drill into individual reports to understand whether quality, execution volume, and automation efforts are improving or drifting over time.
Ask AI for failure analyzing and project insights
Ask Katalon AI project-health related questions, such as "How are failures today?", "Why is this test failing?", or "Is this " to get answers right away without navigating to specific screens.