Live Monitor Dashboard
This document explains what the Live Monitor Dashboard is, how to navigate it, and what its components are.
Overview
The Live Monitor tab in Katalon True Platform offers a centralized, real-time dashboard for monitoring test automation metrics, defect statuses, and test coverage. It enables teams to track ongoing testing activities and quality signals as they happen. This can be used to drive key activities such as:
- Daily Standups: Leverage live data to align on automation progress and critical issues.
- Release Planning: Assess automation coverage and defect status to make informed release decisions.
- Quality Audits: Get a snapshot of testing health to guide continuous improvement efforts.
Navigate the Live Monitor Dashboard
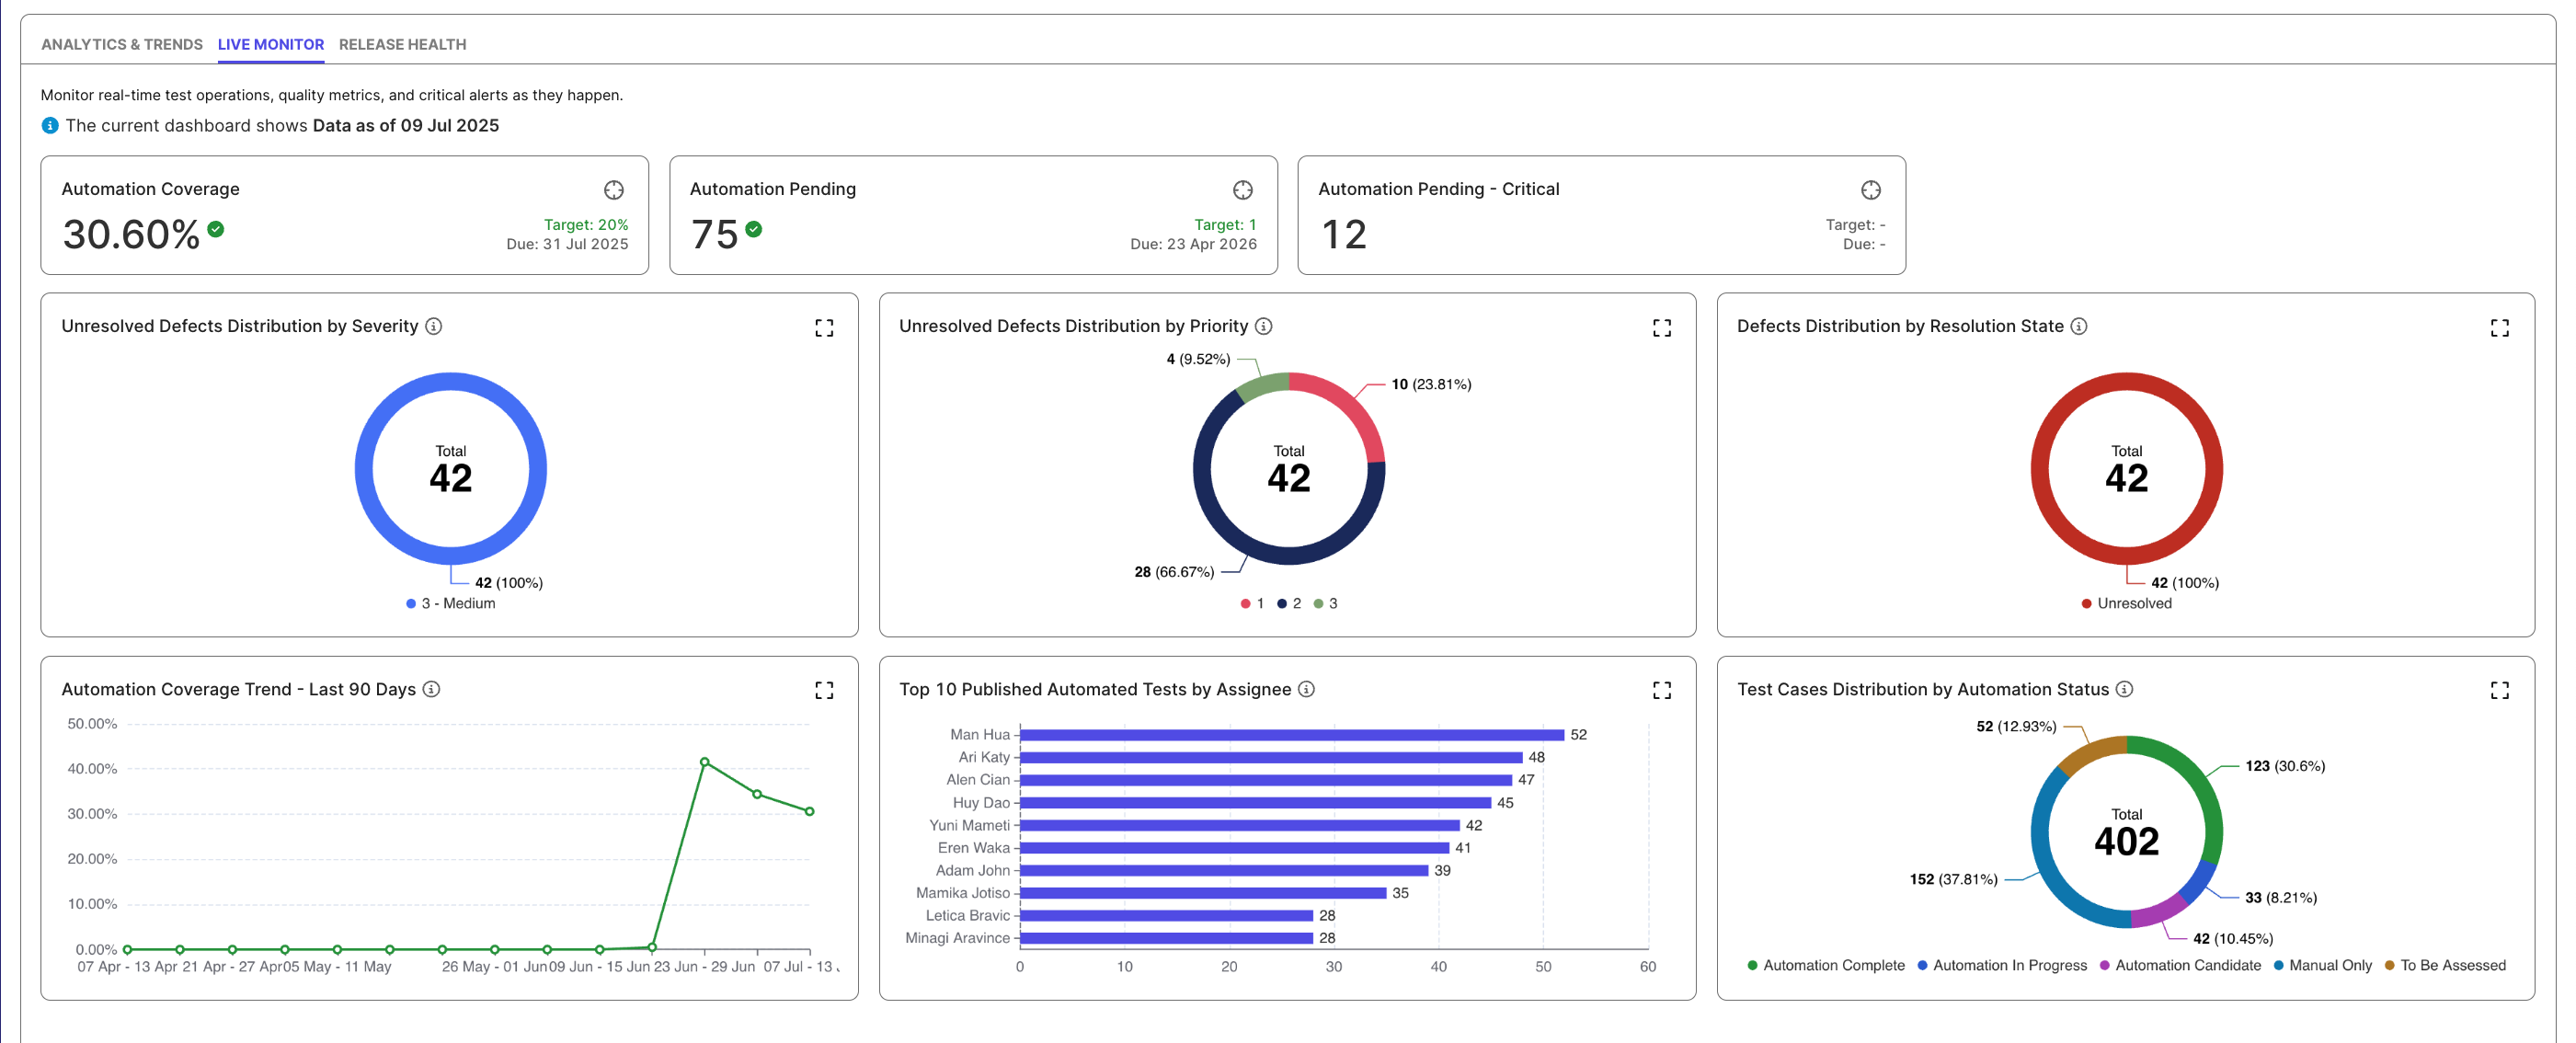
The Live Monitor Dashboard helps teams track real-time testing activity and progress toward automation goals. The QA Lead should first set the target values for top automation cards (Coverage, Pending Automation, Critical Pending) to set or adjust goals, so the entire team can see whether the sprint or release is on track.
-
Check Overall Automation Health: Look at the top metrics (Coverage, Pending Automation, Critical Pending) for current automation coverage, pending items, and critical automation tasks to get an instant understanding of automation status and identify any urgent backlog that may affect the sprint.
-
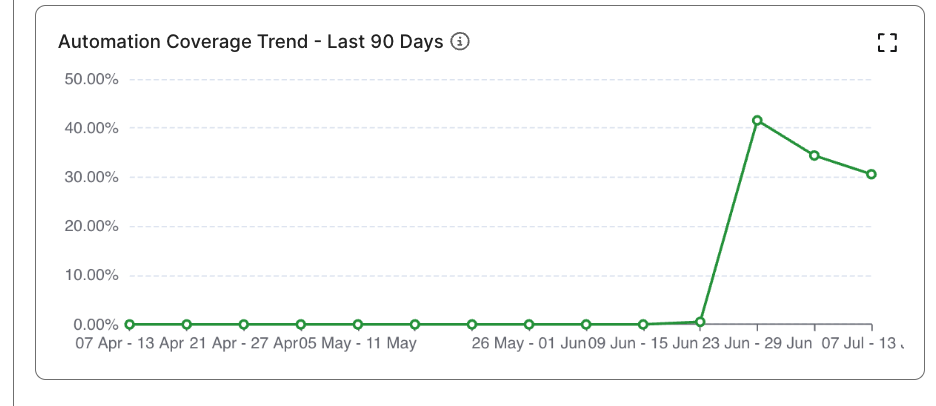
Review Automation Progress Over Time: Scan the 90-day Automation Coverage Trend chart to see whether automation work is moving in the right direction and assess consistency across previous sprints.
-
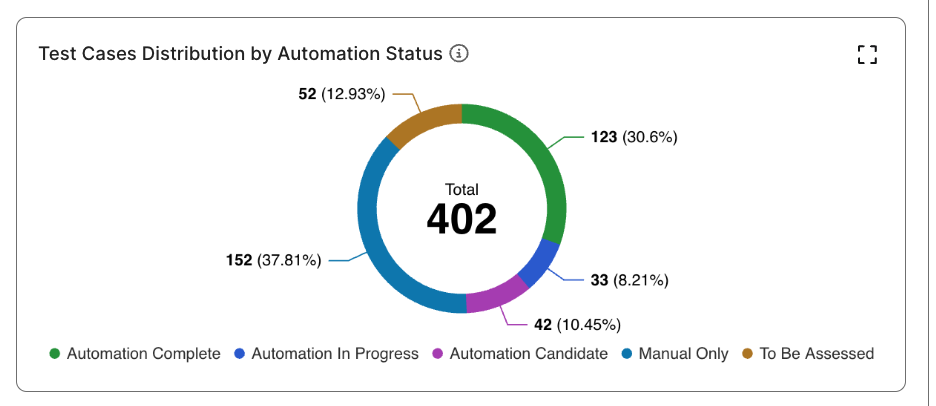
Analyze Test Case Automation Status: Read the automation-status distribution donut (complete, in progress, candidates, manual-only) to understand how the test case inventory is divided, so the team can prioritize which cases to automate next.
-
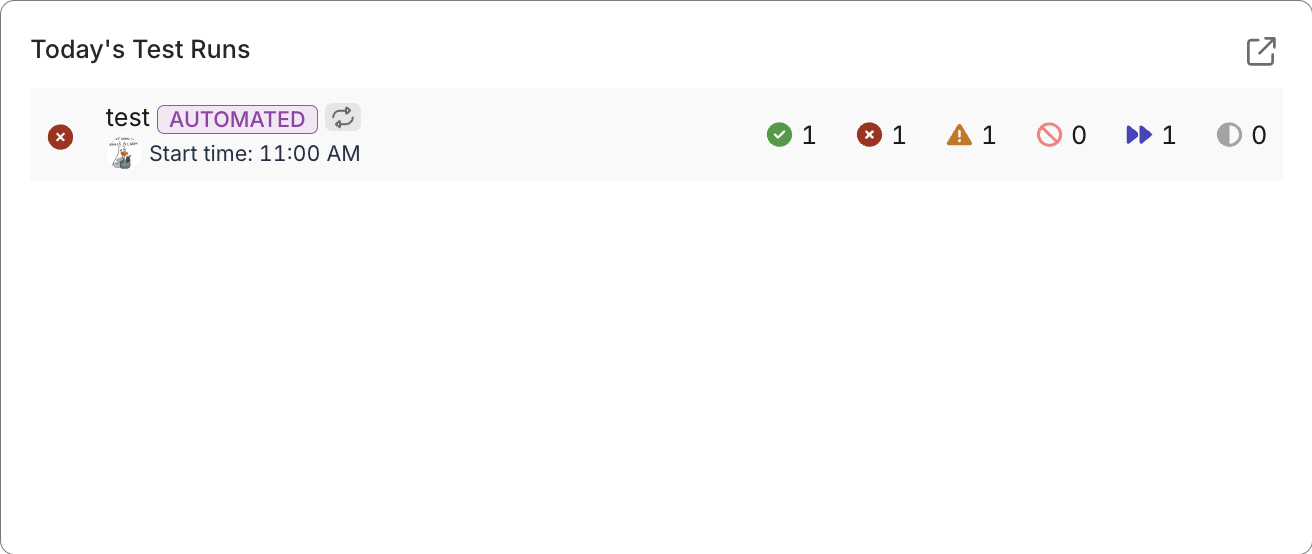
Monitor Active Test Runs: Check “Test Run in Progress” and “Today’s Test Runs.” to track real-time execution activity to identify issues immediately during the testing cycle.
-
Check Unresolved Defects: Review the severity, priority, and resolution-state charts at the bottom to quickly assess product quality risks, highlight blockers, and determine whether defects threaten sprint or release stability.
Live Monitor Components
The dashboard includes the following key widgets:
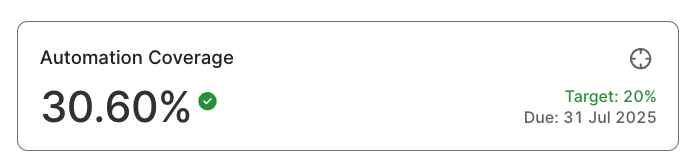
Automation Coverage
To set the target and due date, you need to be a Test Lead role.
Displays the percentage of test cases marked as "Automation Complete" out of all test cases in the project. This metric helps teams assess automation maturity and identify areas where additional automation is needed to improve coverage.
Automation Pending
To set the target and due date, you need to be a Test Lead role.
Displays the total number of test cases marked as either "Automation Candidate" or "Automation in Progress". This metric helps teams monitor the pipeline of test cases awaiting or undergoing automation, supporting effective sprint planning and resource allocation.
- Automation Pending – Critical: Shows the subset of these test cases that are marked with a "Critical" status. This helps teams prioritize automation efforts based on risk and test case importance.

Unresolved Defects
-
Unresolved Defects Distribution by Severity: Displays unresolved defects grouped by severity level. This allows teams to quickly assess the potential impact of outstanding issues on application quality.
-
Unresolved Defects Distribution by Priority: Displays open defects grouped by priority level, based on your ALM’s mapped Priority field. This helps teams focus defect resolution efforts on the most impactful issues first.
-
Unresolved Defects Distribution by Resolution Status: Visualizes unresolved defects by their Resolution status (e.g., Open, Unresolved). This offers insight into defect lifecycle and resolution velocity.
Defect priority/severity are Katalon True Platform's native terms, not your ALM tool's. Configure mapping between the terms when configuring your ALM tools.

Automation Coverage Trend (Last 90 Days)
Visualizes changes in Automation Coverage over the past 90 days. Use this trend to evaluate the velocity and consistency of your automation efforts over time, and to identify periods of progress or stagnation.
Displays unresolved defects grouped by their workflow status (e.g., Open, In Progress, Reopened). Provides insight into the defect lifecycle and helps assess the pace of issue resolution.
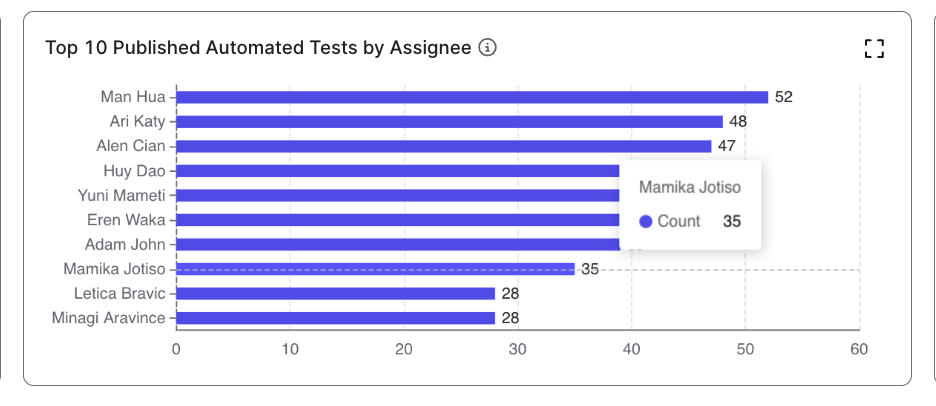
Contributor Activity
Highlights the top 10 contributors to automated test development. This encourages recognition and promotes team collaboration.
Test Case Distribution by Automation Status
Breaks down test cases by their automation status (e.g., Completed, In Progress, Pending). This is useful for workload assessment and test planning.
Today's Test Runs
Lists today's test runs and breaks down their results (passed, failed, error, blocked, skipped, incomplete). This provides a shortcut to investigating test failures of the day.