Features
This document explains Analytics features and how you can best use them to assess your project.
Core Features
Upload test reports
Katalon True Platform allows integration with test reports from executions in Katalon Studio or the following testing frameworks, so they can be analyzed in one place:
- Katalon Studio
- Jasmine
- Jest
- Playwright
- Mocha
- Protractor Jasmine
- Protractor Mocha
- Pytest
- Robot Framework
After test reports are uploaded, you can view execution data across dashboards, reports, or open a test result details for failure analysis and trend tracking. Your team can review past, current, and to-be-scheduled execution results in a single project context.
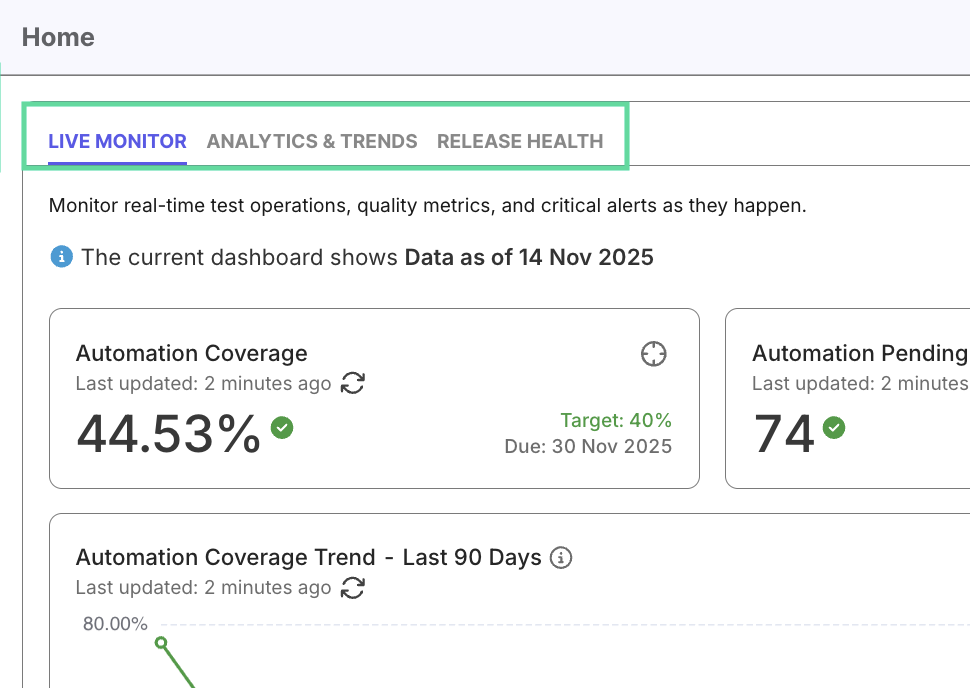
Dashboards and Reports
Katalon True Platform provides dashboards for summaries and reports for deeper analysis.
- Dashboards (e.g., Analytics & Trends, Release Readiness, Live Monitor) give a quick overview of test health and execution progress.
- Reports (e.g., Test Runs Analysis, Defect Trends, Requirement Coverage) let you drill into details to identify issues or improvement opportunities.
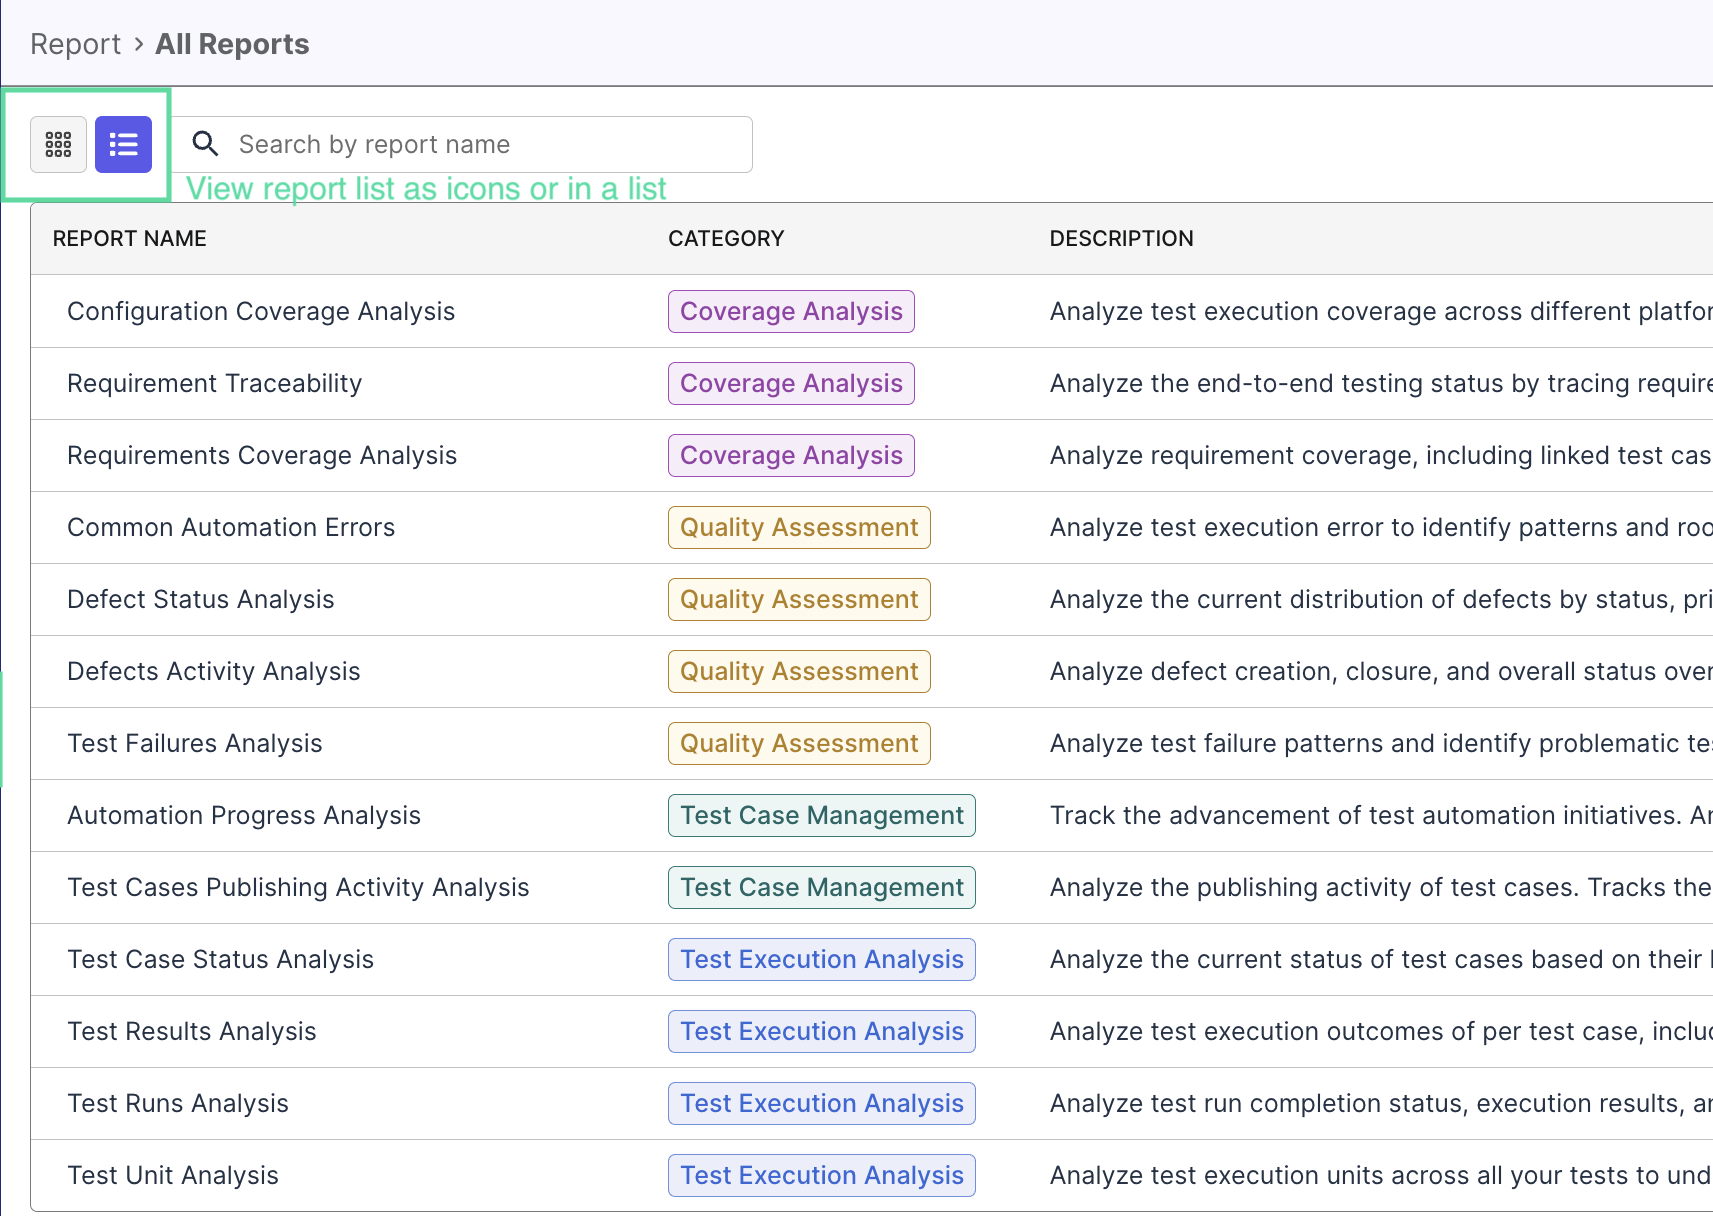
Together, dashboards and reports offer both high-level awareness and detailed investigation capability.
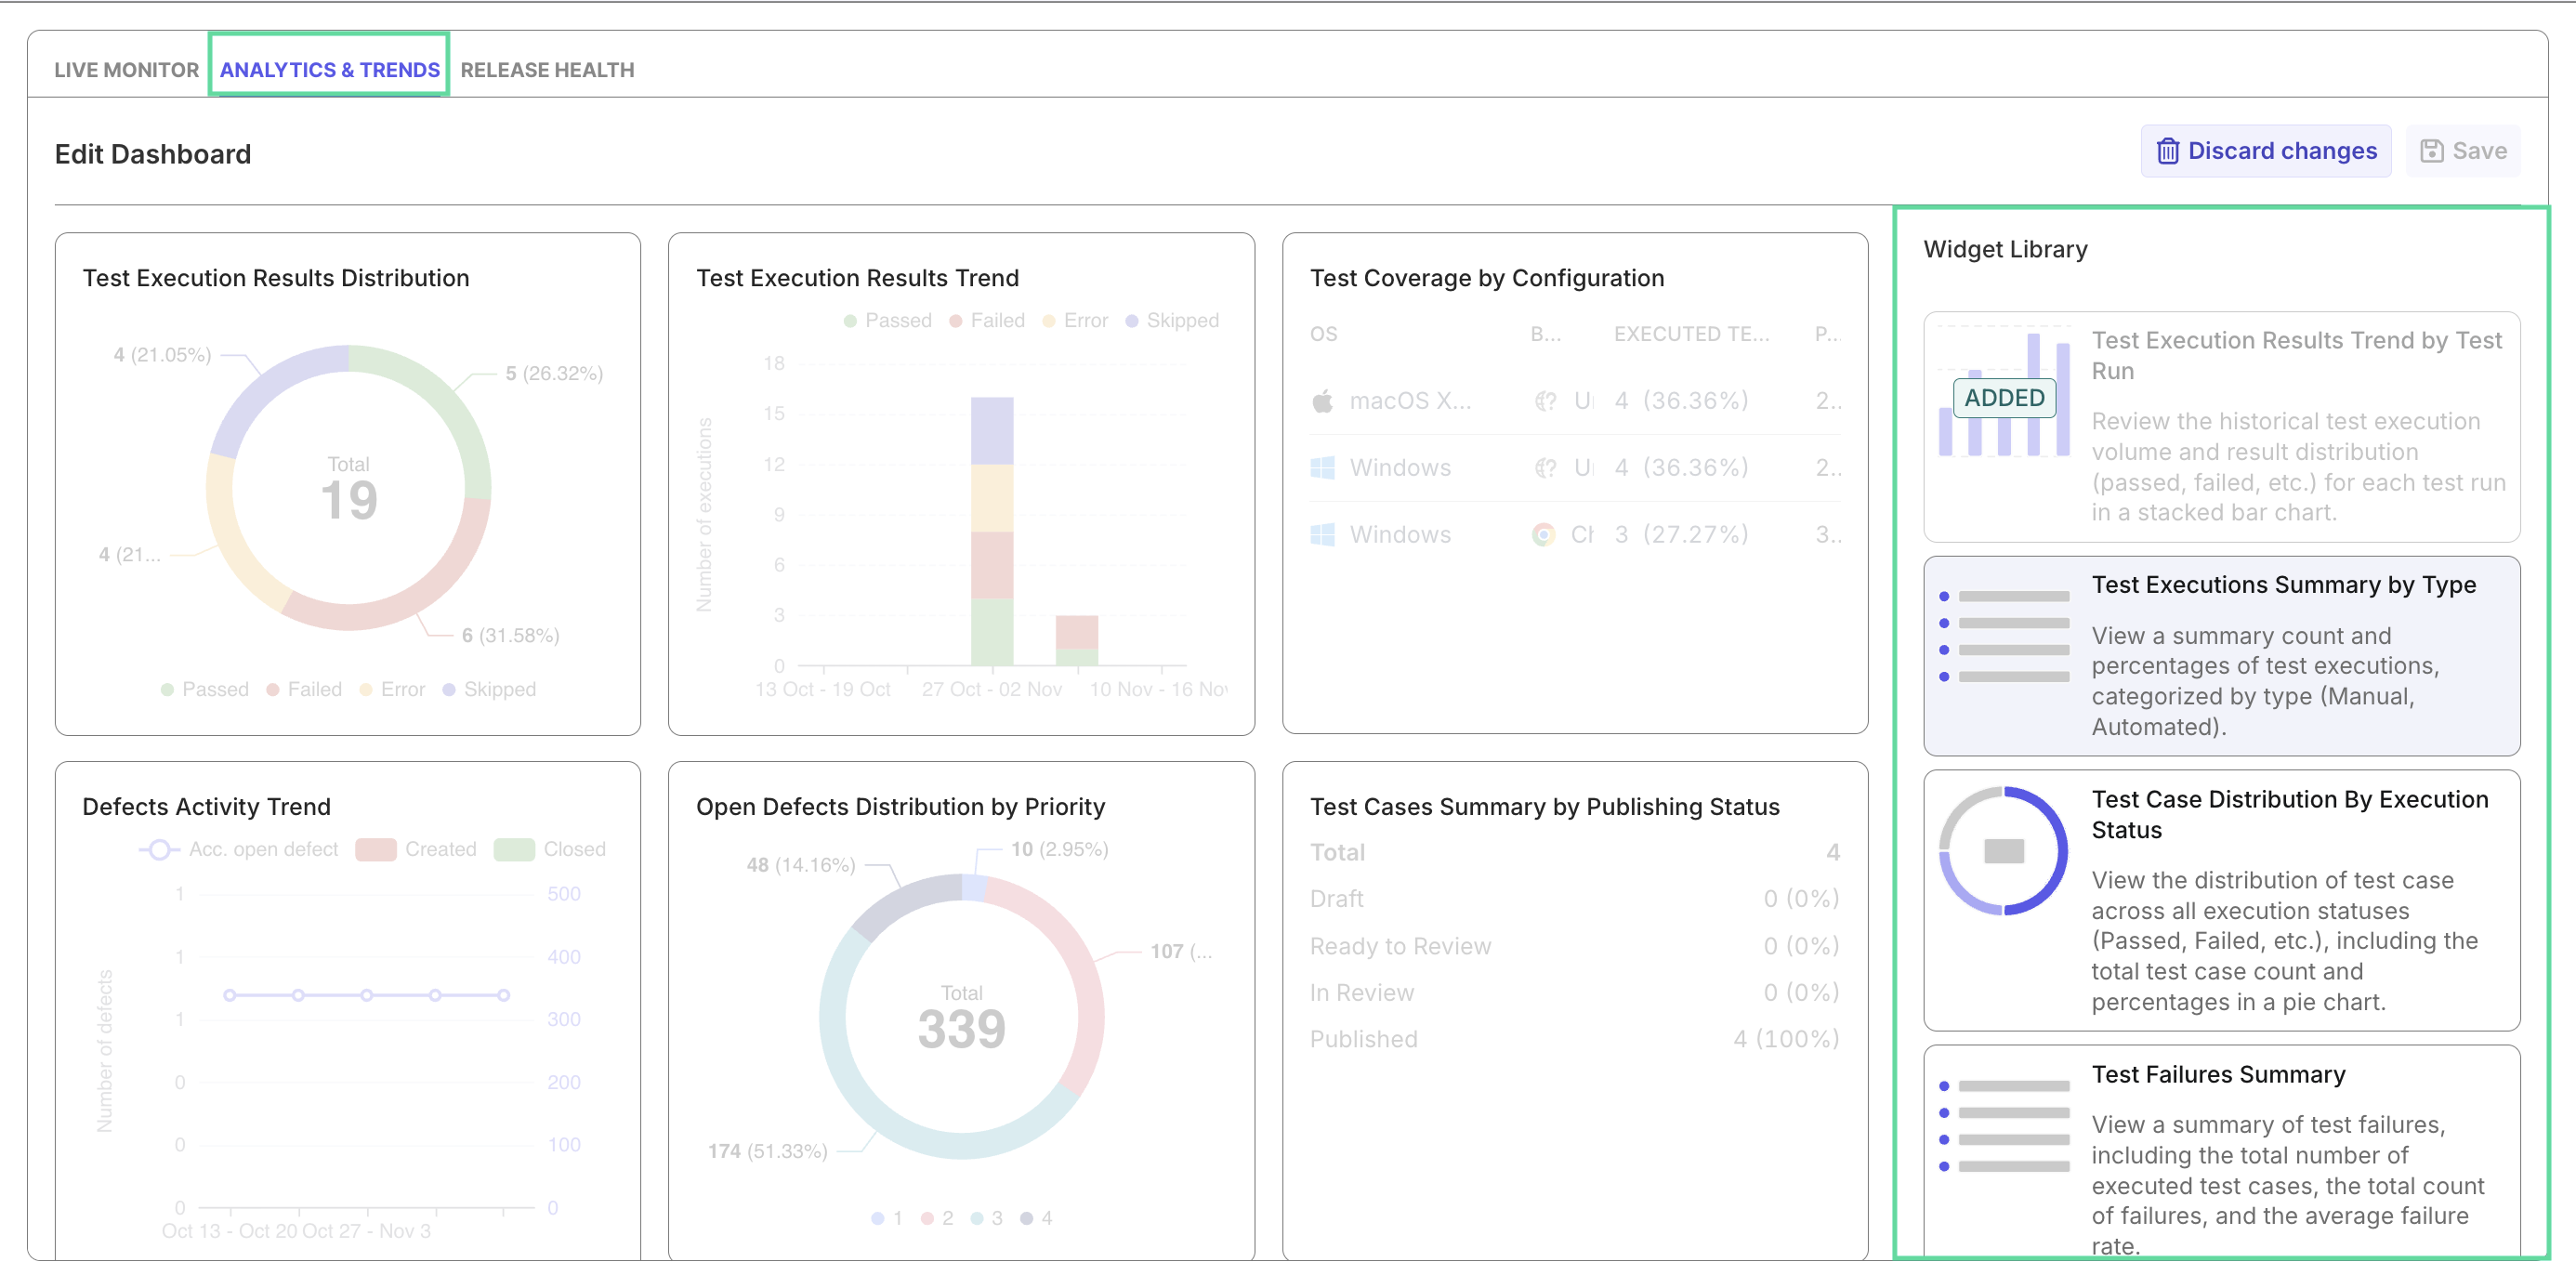
Custom Dashboards and Widgets
You can also create custom dashboards with existing widgets or custom widgets that you can make from scratch, to analyze different aspects of your project.
Scoping
All analytics in Katalon True Platform are project-based. Each project aggregates entities like test cases, executions, requirements, and defects drawn from integrated tools such as Jira and Azure DevOps.
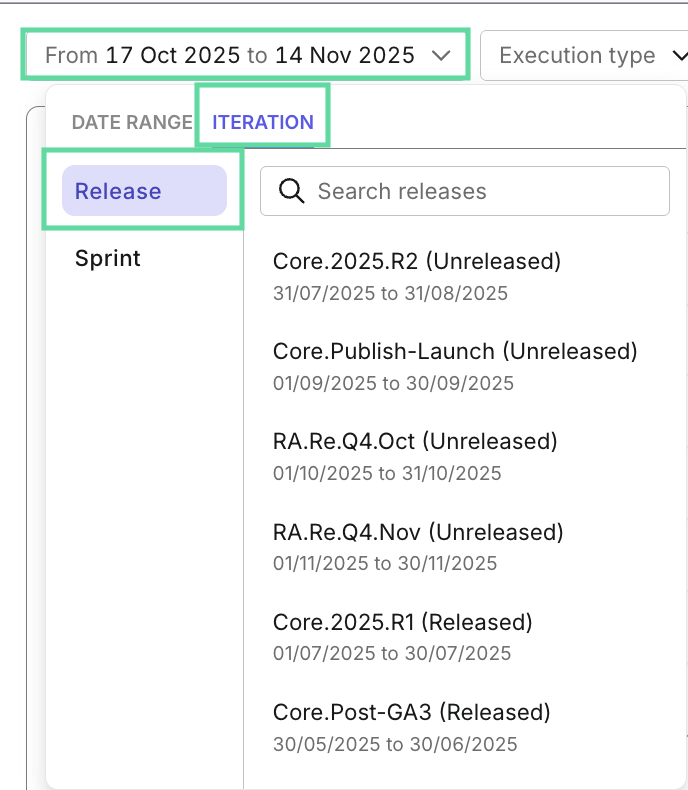
Data from these entities are presented in either of these perspectives, that you can choose from in each dashboard/report:
- Time-Based: to observe historical trends or productivity changes.
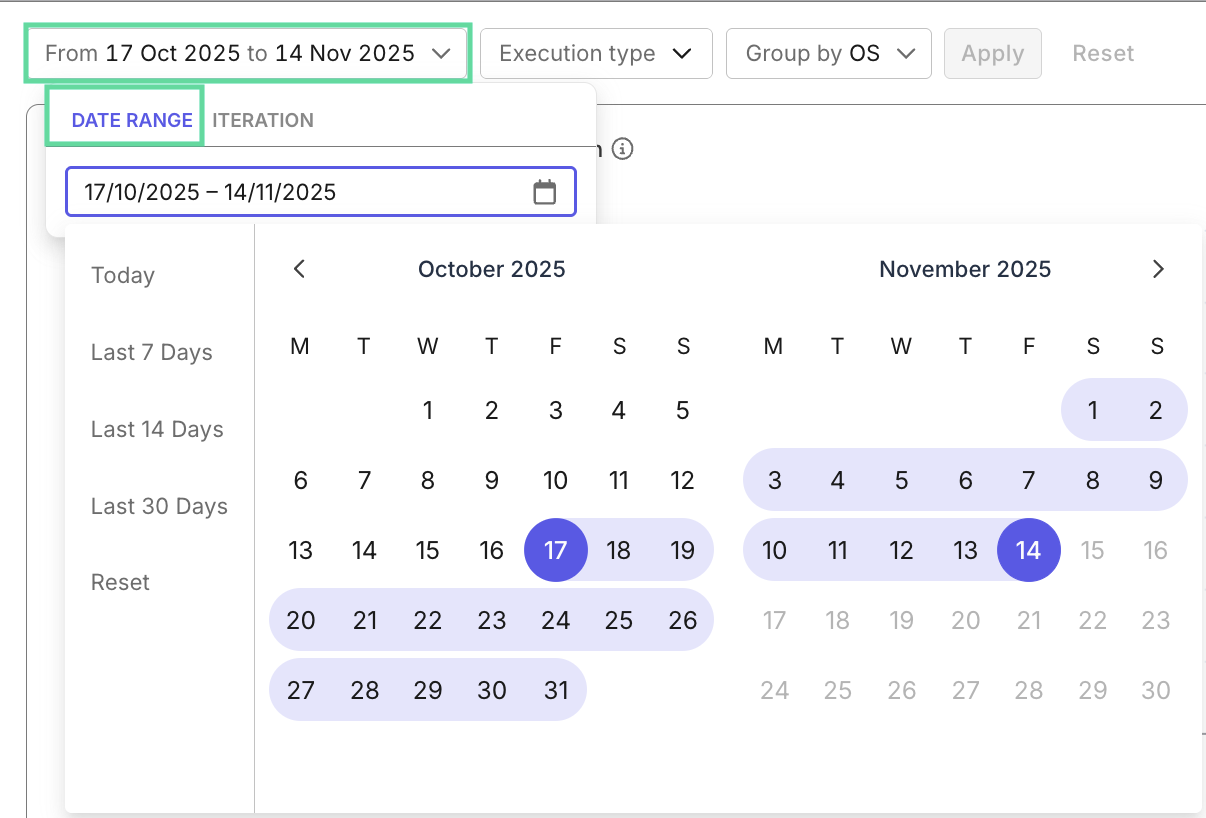
- Iteration-Based - Release or Sprint: to evaluate iteration progress and quality.
- Current: to assess all available data of the project.
- Some reports/dashboards don't have all scopes available, due to its analysis goal.
- Releases and sprints without a start and/or end date can still appear in True Platform. Provide these dates for effective analysis.
Filtering
Reports and dashboards have filters so you could filter data and compare between filtered datasets (e.g. automation vs manual tests, performance between test authors...) to discover trends and anomalies. Each report/dashboard has unique filters you could select via the filter dropdown:
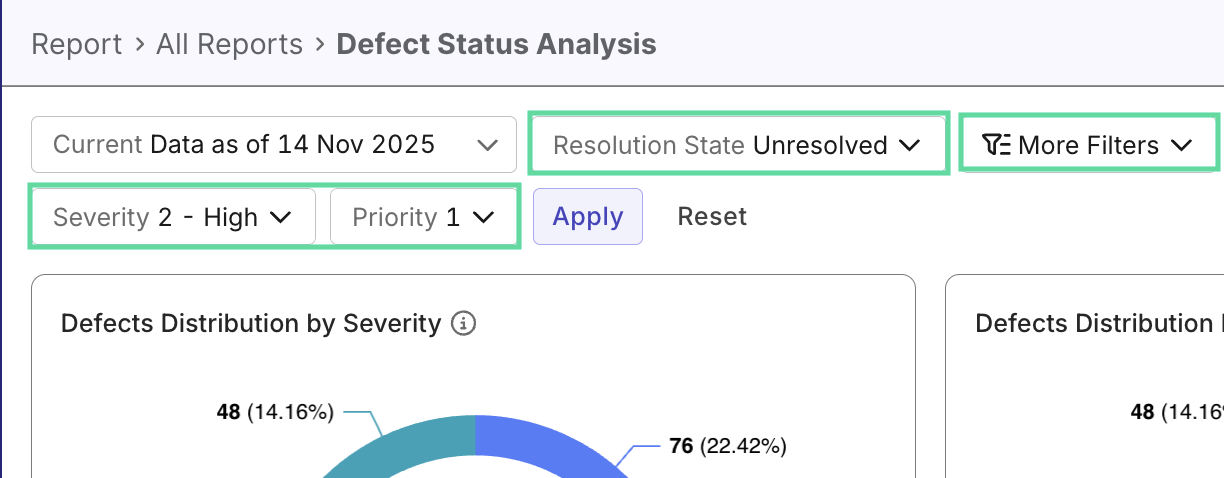
There are two types of filters:
- Default filters: Each report/dashboard has default filters by entities (for example, Test Case Status, Defect Priority, Run Type,...) depending on the report purpose.
- Customizable field filters: You can configure customizable fields to add more attributes to testing entities, and later on filter by these attributes inside reports. They help you effectively further slice data by your project needs (e.g. regression testing,... ) to uncover unexpected insights.
This gives you precise control over what data is shown, while keeping all widgets and reports synchronized to the same filter context.
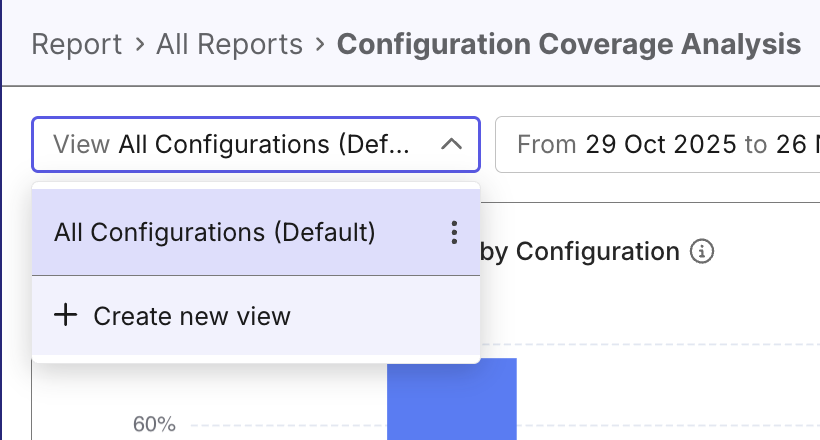
Custom Views
In any report, you can create custom views that store filter for different perspectives, to quickly switch between them without reconfiguring the filters each time. This is especially useful when you regularly configure one report for different purposes—such as focusing on failed automated tests, tests from specific suites, or activity within a particular sprint.
With the custom views, every report becomes a personalized workspace that adapts to the way you analyze quality.
What you can do:
- Save filter configurations: After applying filters in any report, save them as a new view with a descriptive name.
- Switch between views instantly: Use the view selector at the top of the report to load saved filter combinations with a single click.
- Set a default view: Mark your most-used view as the default so it automatically loads whenever you open that report.
- Manage your views: Edit, clone, or delete saved views as your analysis needs change.
Widgets and Visual Insights
Dashboards are composed of widgets, modular visual elements that summarize metrics from underlying reports. You can expand widgets to view more details and see the report it's linked to:
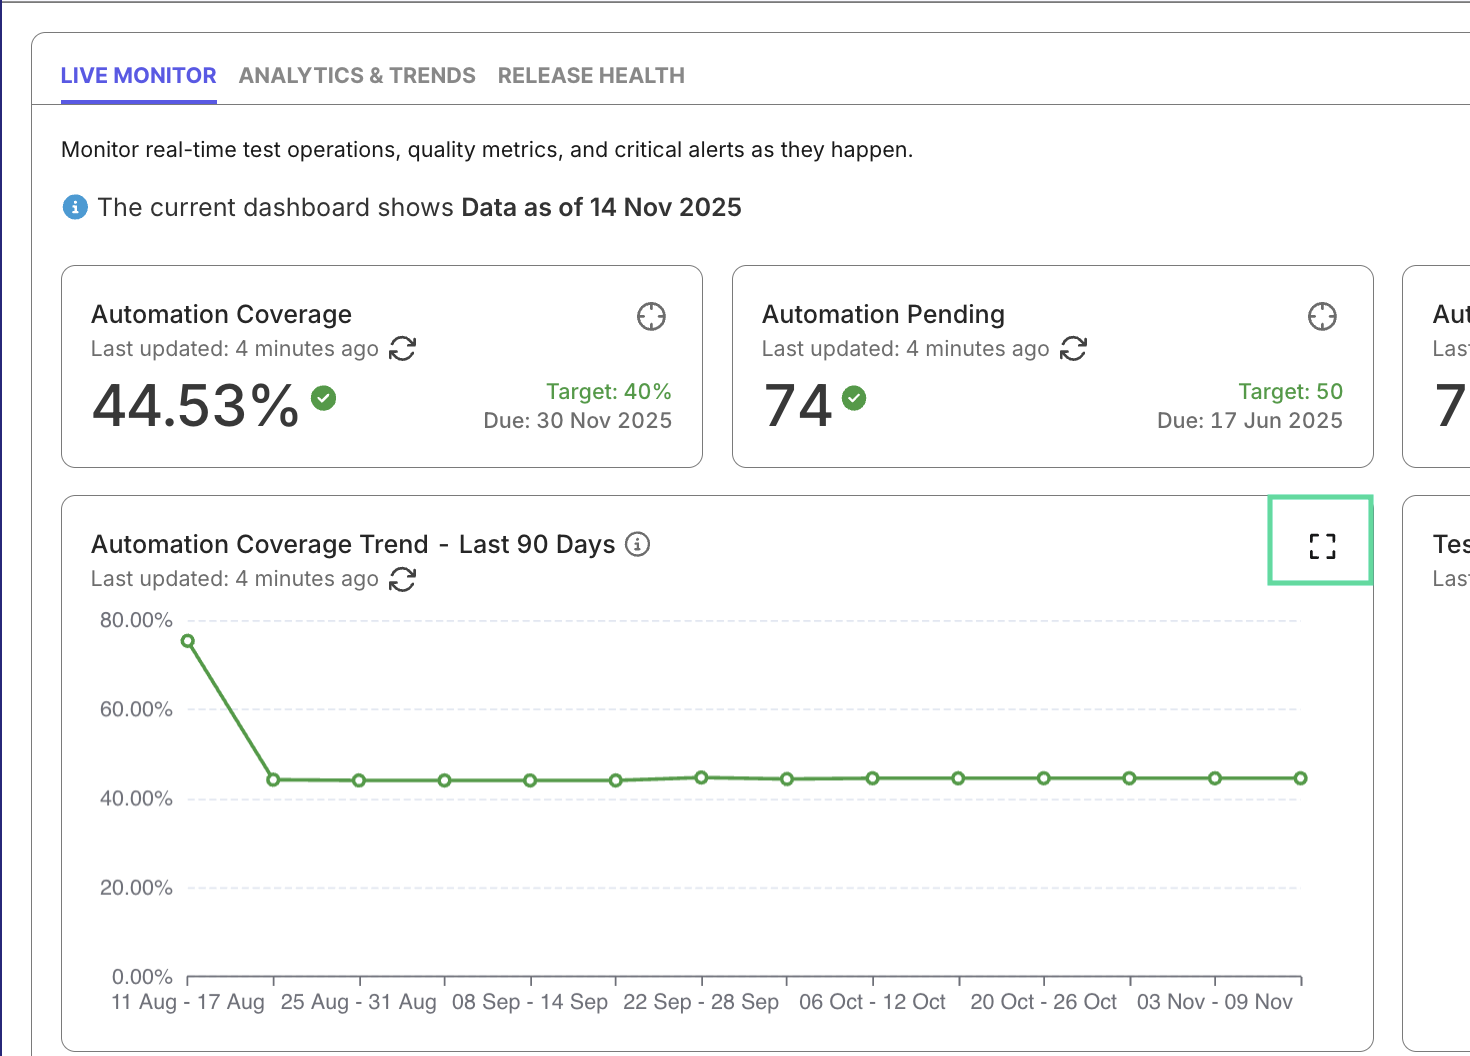
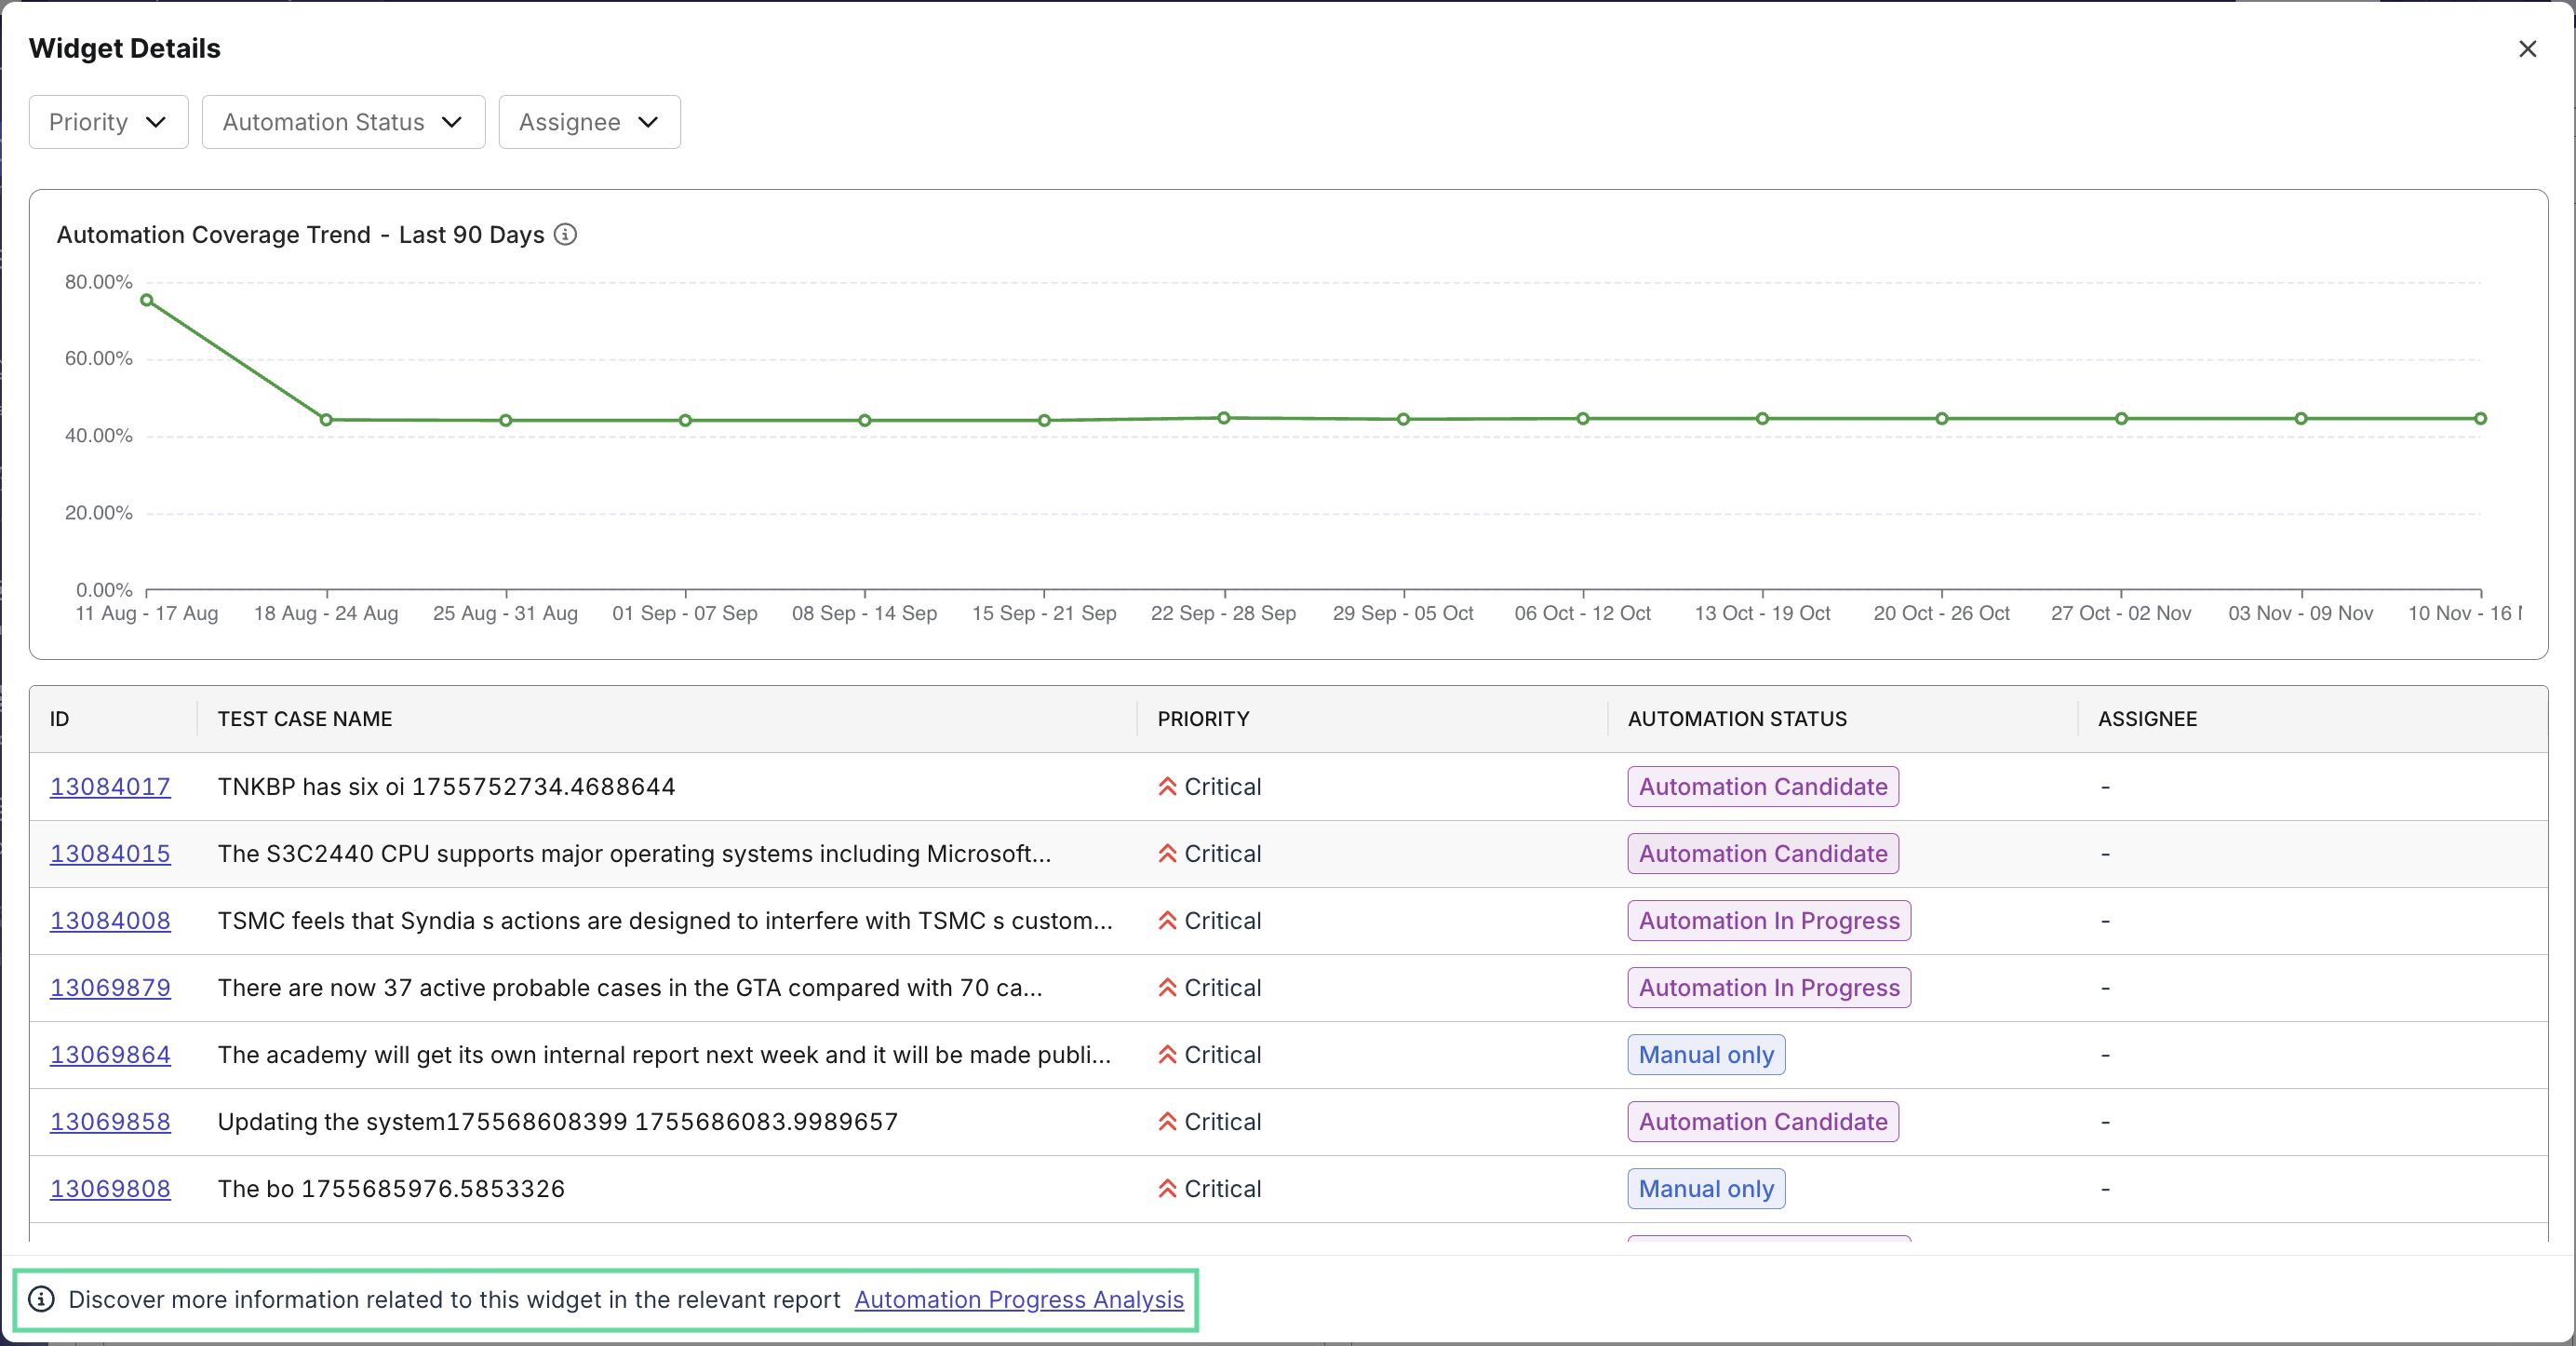
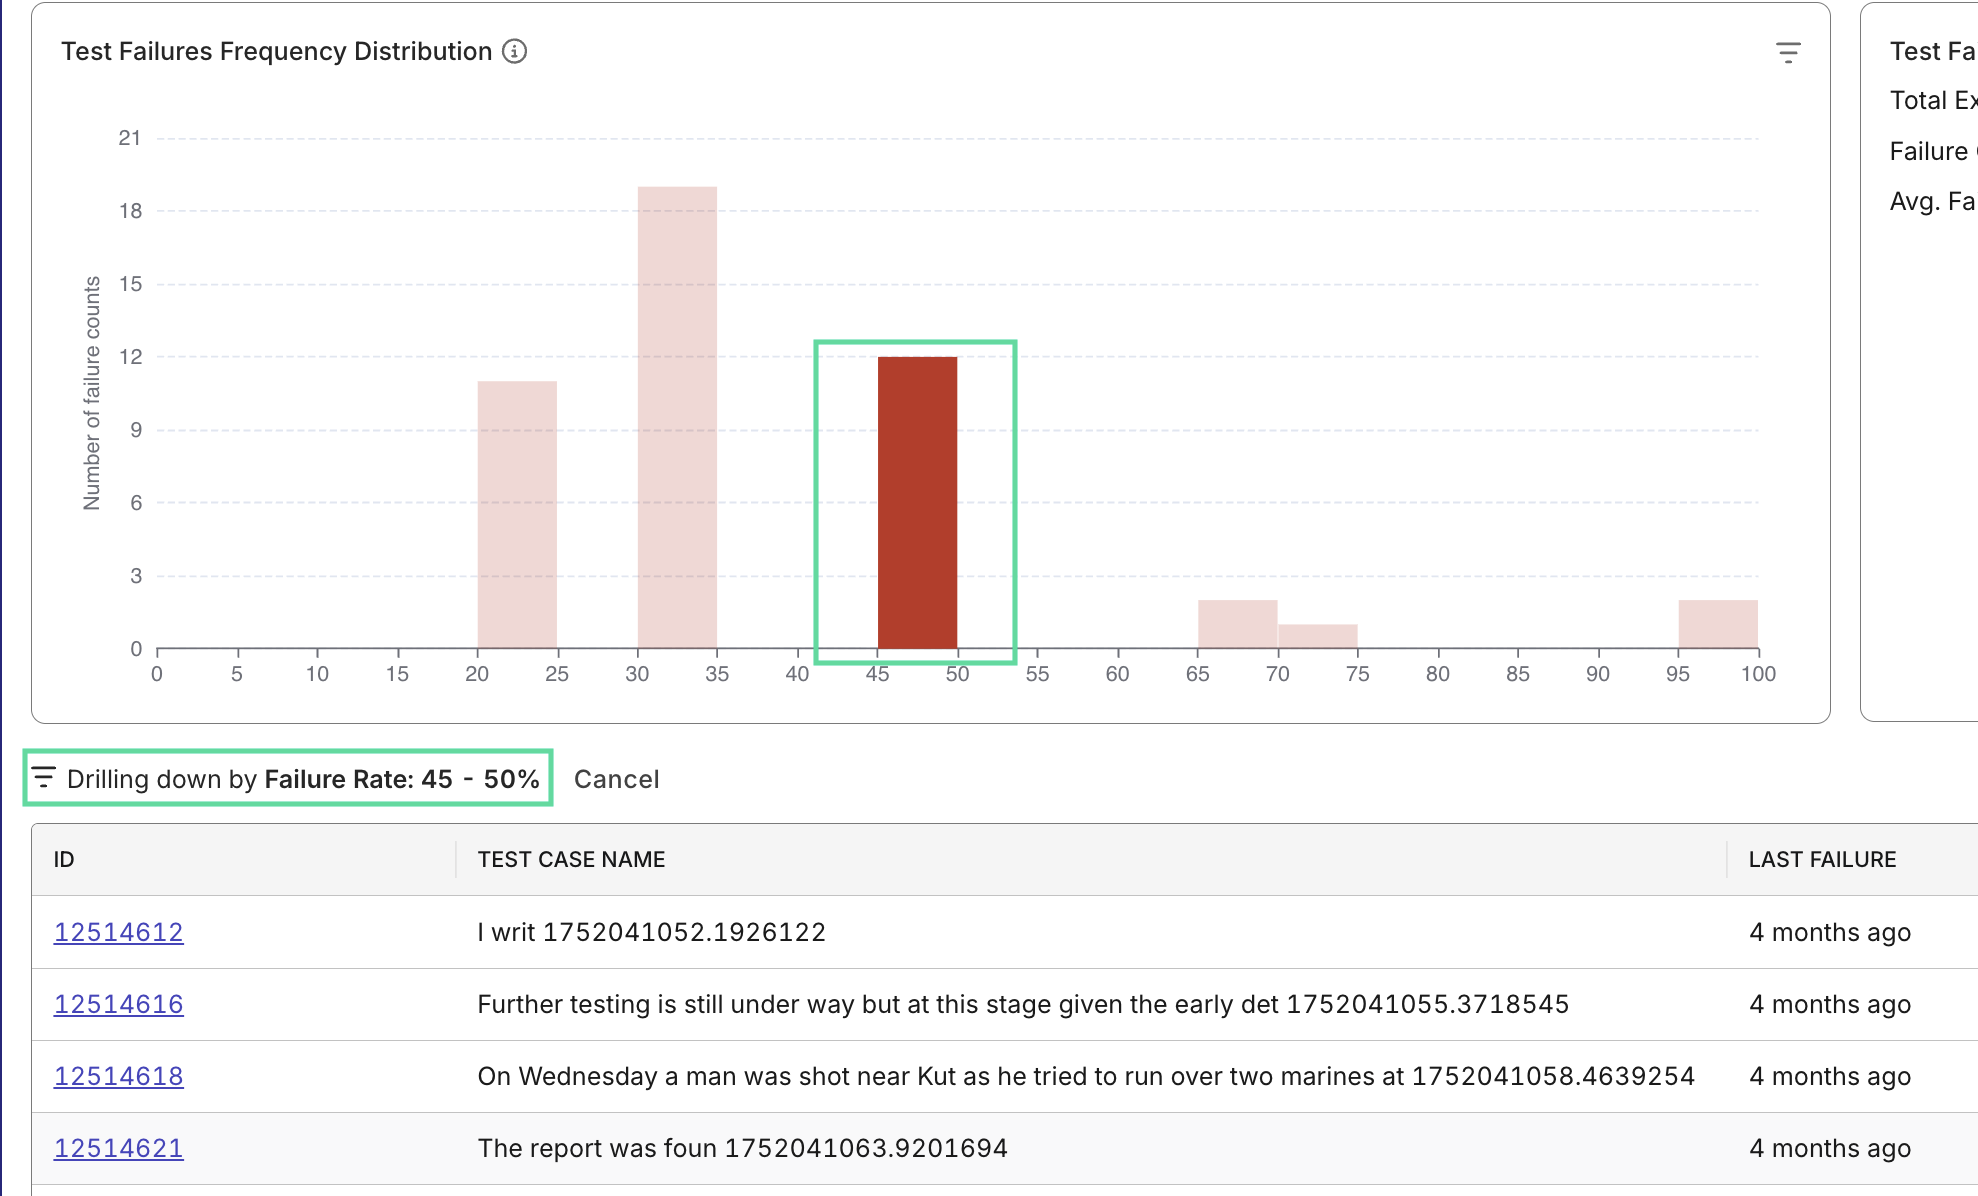
While widgets are static in dashboards, they become interactive report view - clicking a segment filters and refreshes the related data view below it. This allows seamless transition from visual overview to analytical evidence.
For Analytics & Trends dashboard, you can customize the dashboard by adding more widgets pulled from reports, to tailor to your team's needs.
Export and Sharing
Each dashboard or report can be exported to PDF, CSV, or Excel for record-keeping or shared directly via link. This simplifies collaboration and enables teams to review the same data during stand-ups, sprint reviews, or release planning.
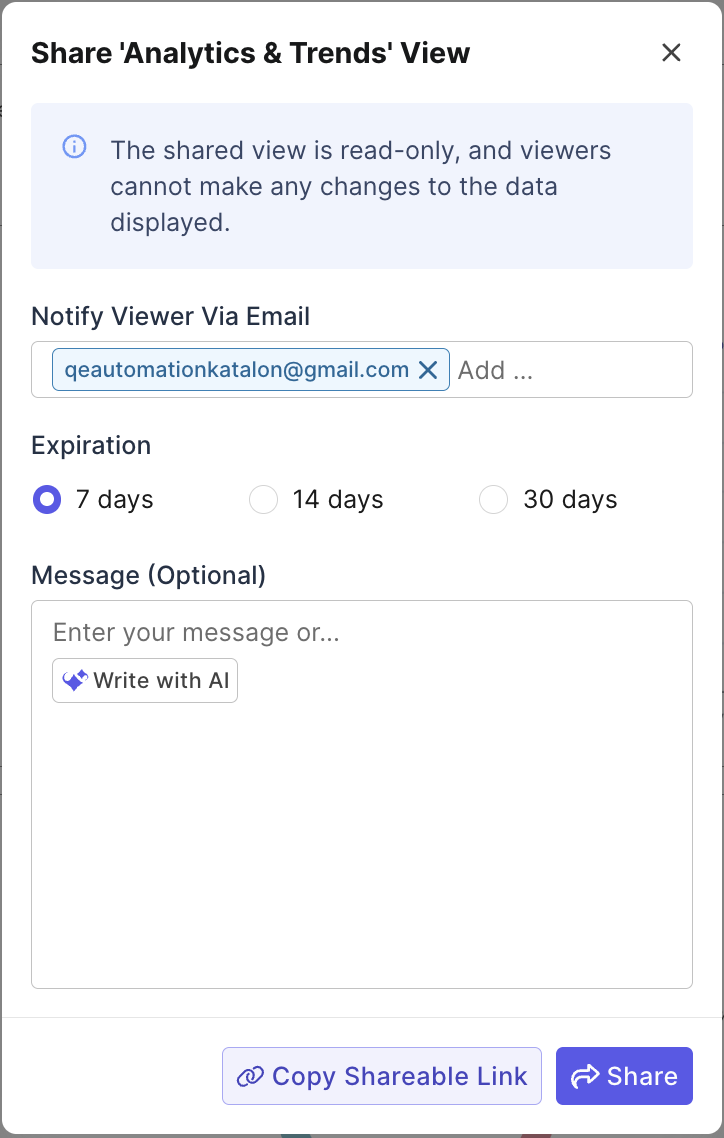
Click Write with AI to prompt the agent to write a description for you before sharing.
AI features
Analytics' AI features turn raw test data into triage insights to speed failure investigation and internal communication.
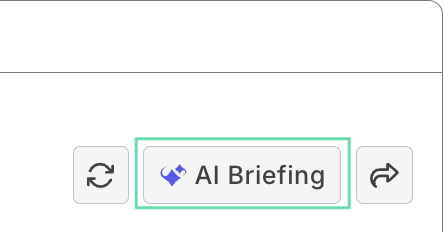
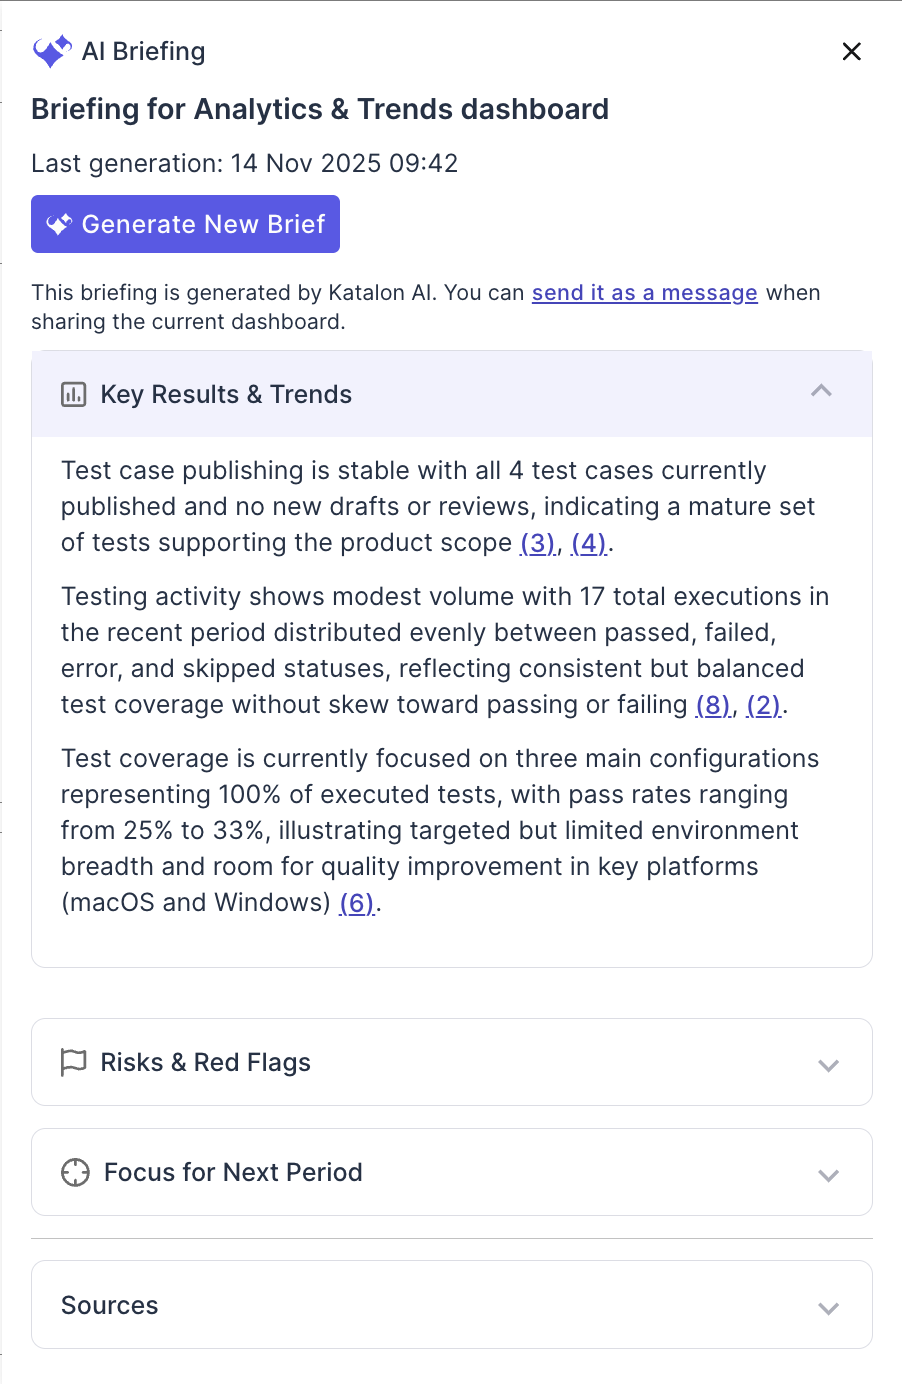
AI Briefing
The AI Briefing feature condenses report data into concise, insight-ready text for stakeholders. It captures key achievements, risks, and trends to support executive briefings and retrospectives with minimal effort.
AI Analysis
The AI Analysis feature analyzes the full test-execution context (logs, traces, screenshots,... ) and then generating a failure analysis with failure summary, and suggestion for remedy.
Insights
When you click Insight from a dashboard or report, the assistant uses the current page context, such as the selected view, scope, and filters, to explain trends, summarize notable changes, and highlight anomalies relevant to that data.
After answering the initial prompt, the assistant can also suggest follow-up questions so you can continue exploring the same view in more detail. This helps you move from a quick summary to deeper analysis, such as identifying why failures increased, which segment contributed most to a change, or what shifted between releases or sprints.
AI Failure Grouping
From a failed result, the Analyze feature or direct chat with the agent can analyze the execution context (logs, stack traces, screenshots, and scripts) to identify root-cause signals, determine whether the issue looks flaky or script-related, and assign the failure to common categories for Analyzing automation error patterns.