Cross-Project Dashboards
This document explains how to create and view cross-project dashboards in Katalon True Platform from the cross-project view.
- A dashboard shows data only from projects that you have access to. If you cannot view a project's reports, its data does not appear in the dashboard.
- To create a dashboard, you must have either the Project Admin or Test Lead role in the base project.
A cross-project dashboard helps you monitor data from multiple projects in one place. This is useful when you need portfolio-level visibility, aggregated progress monitoring, or cross-project trend comparison across related projects instead of reviewing each project separately.
Common analysis purposes for cross-project dashboards include:
- Gain portfolio-level visibility
- Monitor progress
- Compare quality trends
- Check release readiness
- Compare execution trends across teams, products, or environments
- Spot quality risks
- Track shared QA KPIs
You can work with dashboards from two places:
- Within a project: go to Project > Analytics tab > Dashboards. See Create Custom Dashboards.
- From the cross-project view: a top-level entry that lists dashboards from every project you can access, in one place. This document covers this entry.
Open the cross-project view
In the sidebar, select Cross-project view to arrive at the Dashboards page.
The Dashboards page lists the dashboards from all projects you can access, with their name, project, access level, creator, and timestamps. You can search dashboards by name, or filter them by creator and creation date.
Watch this walkthrough of the cross-project view, from opening the dashboard list to creating and viewing a cross-project dashboard:
Create a cross-project dashboard
-
In the cross-project view, click Create Dashboard.
-
In the Create dashboard dialog, select a base project, then click Continue to builder.
A dashboard is always stored in one project. The base project only decides where the dashboard is stored - its widgets can still include data from every project you can access. The dialog lists only the projects where you can create dashboards.
-
Build the dashboard as you would build a custom dashboard: drag widgets from the Widget Library, then click Save Draft (private) or Save and Publish. See Create Custom Dashboards for details on widgets, filters, and saving options.
View a dashboard across projects
-
In the cross-project view, open a dashboard.
-
In the project selector, select the projects whose data you want to include. Projects are grouped by organization, and you can use Select All to include every project you can access. Click Apply.
noteIf a selected project does not contain data to show on a widget, that project contributes zero records and does not affect data display from other projects.
-
Adjust the time range and filters.
As releases and sprints are not the same across projects, it's best to select time range as the data scope for consistent analysis.
View project data breakdown in custom widgets
Breaking down widget results by project helps you understand how each project contributes to the overall dashboard data.
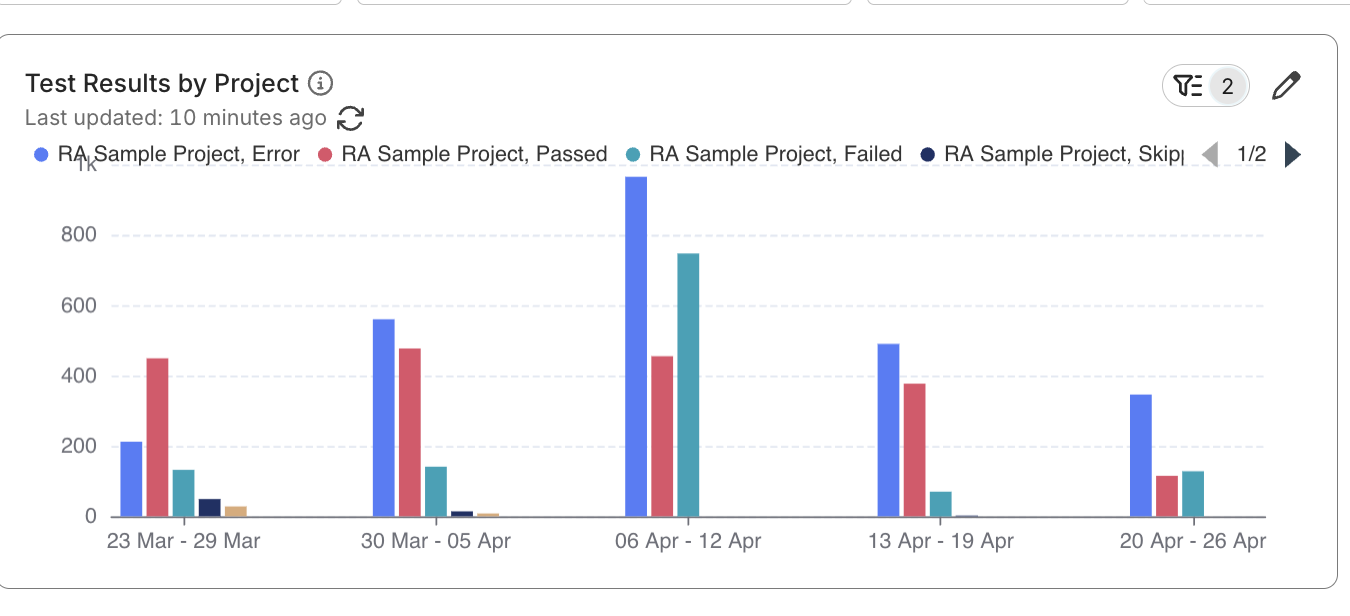
Your custom dashboard must contains a custom widget. See Create a Custom Widget to learn more.
If you want to see which selected projects contribute data to a custom widget, you can break down the widget results by project name.
-
Open the dashboard, then click Edit on the custom widget that you want to inspect.
-
In Break down by, add Project Name.
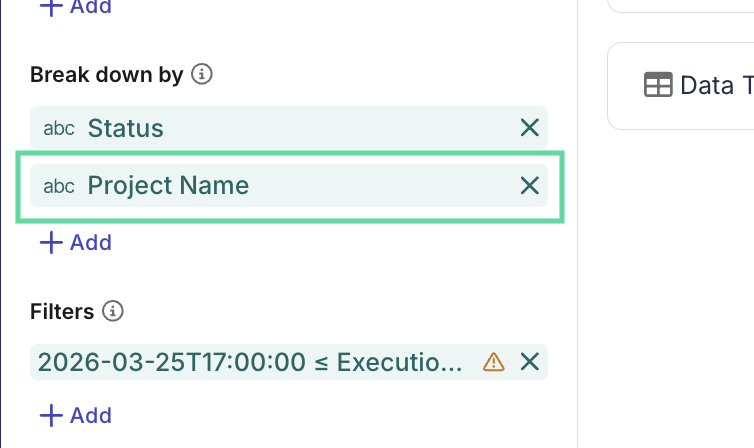
- Save the widget and return to the dashboard.
The configured widget now shows data breakdown by projects, so you can see how each project contributes to the overall result.