View test reports
This document explains how to view test run/result details for automated and manual test executions in Katalon True Platform.
Overview
For an executed test run, Katalon True Platform auto-uploads its report and displays the test run's details as well as individual test case results in both high-level and granular view.
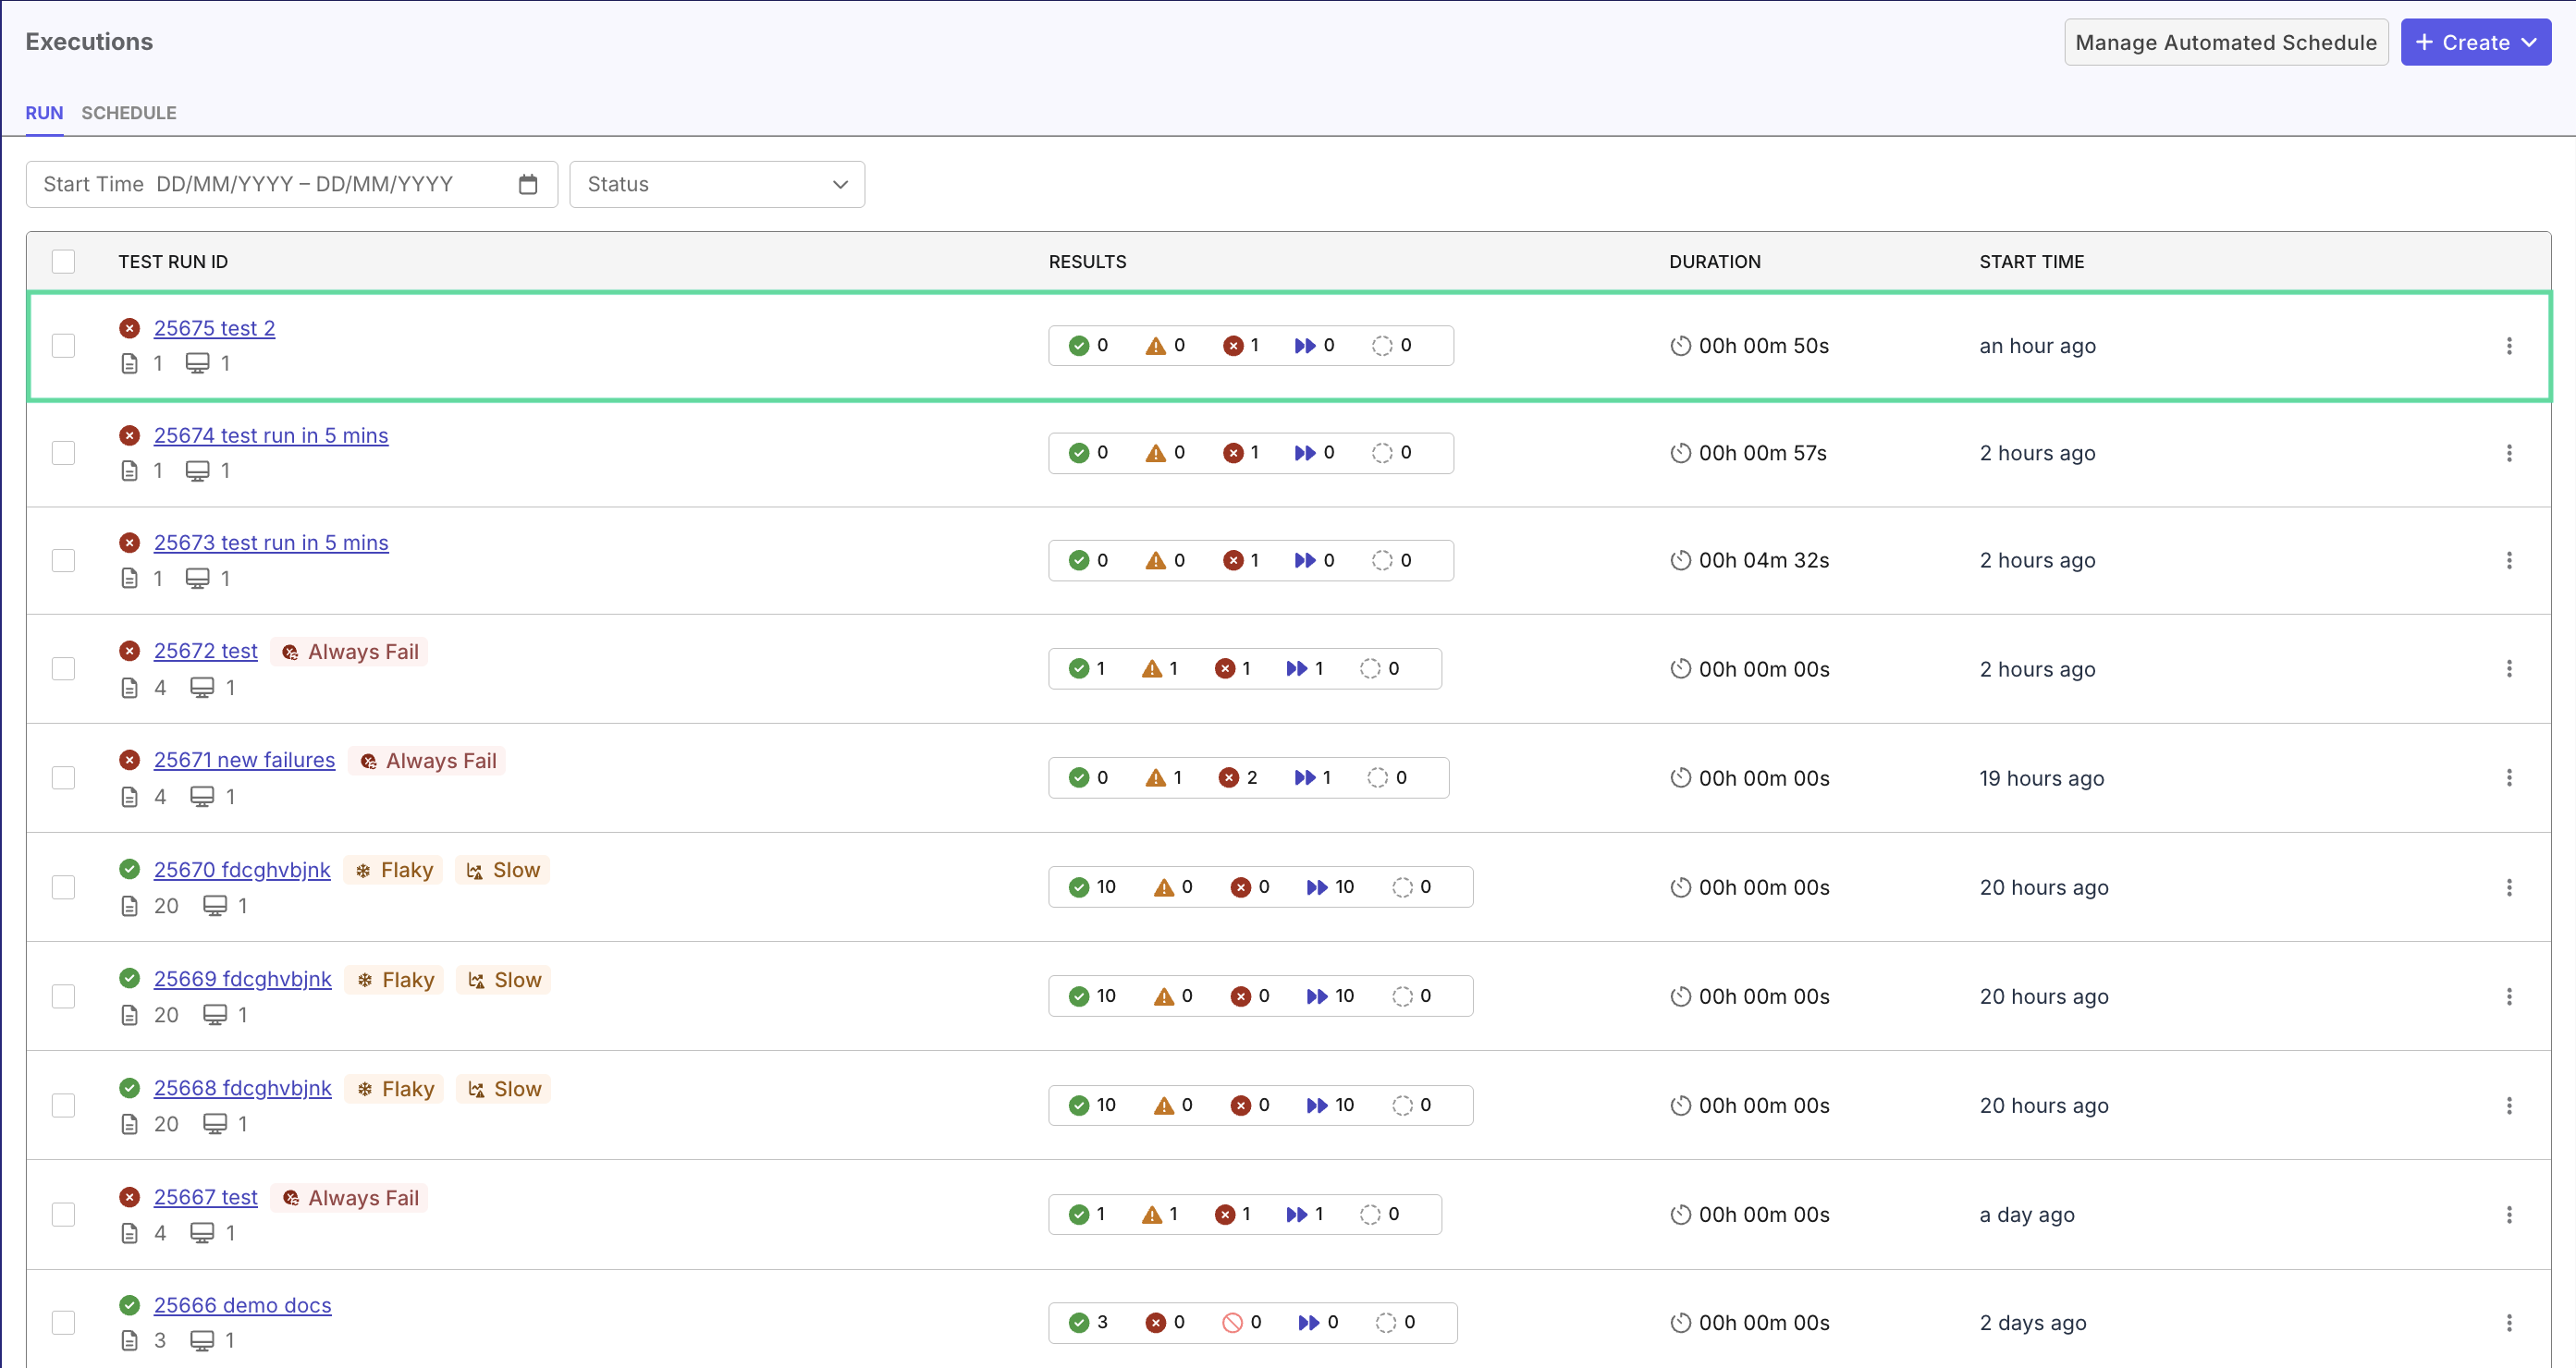
In Executions > Run, you can see a list of test reports and their details like results (counts of test results by statuses), duration, start time, and smart tags (if any) for each test run:
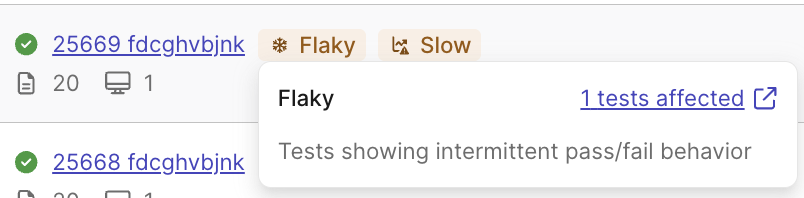
Hovering on each smart tag displays a summary of troubling test cases inside:
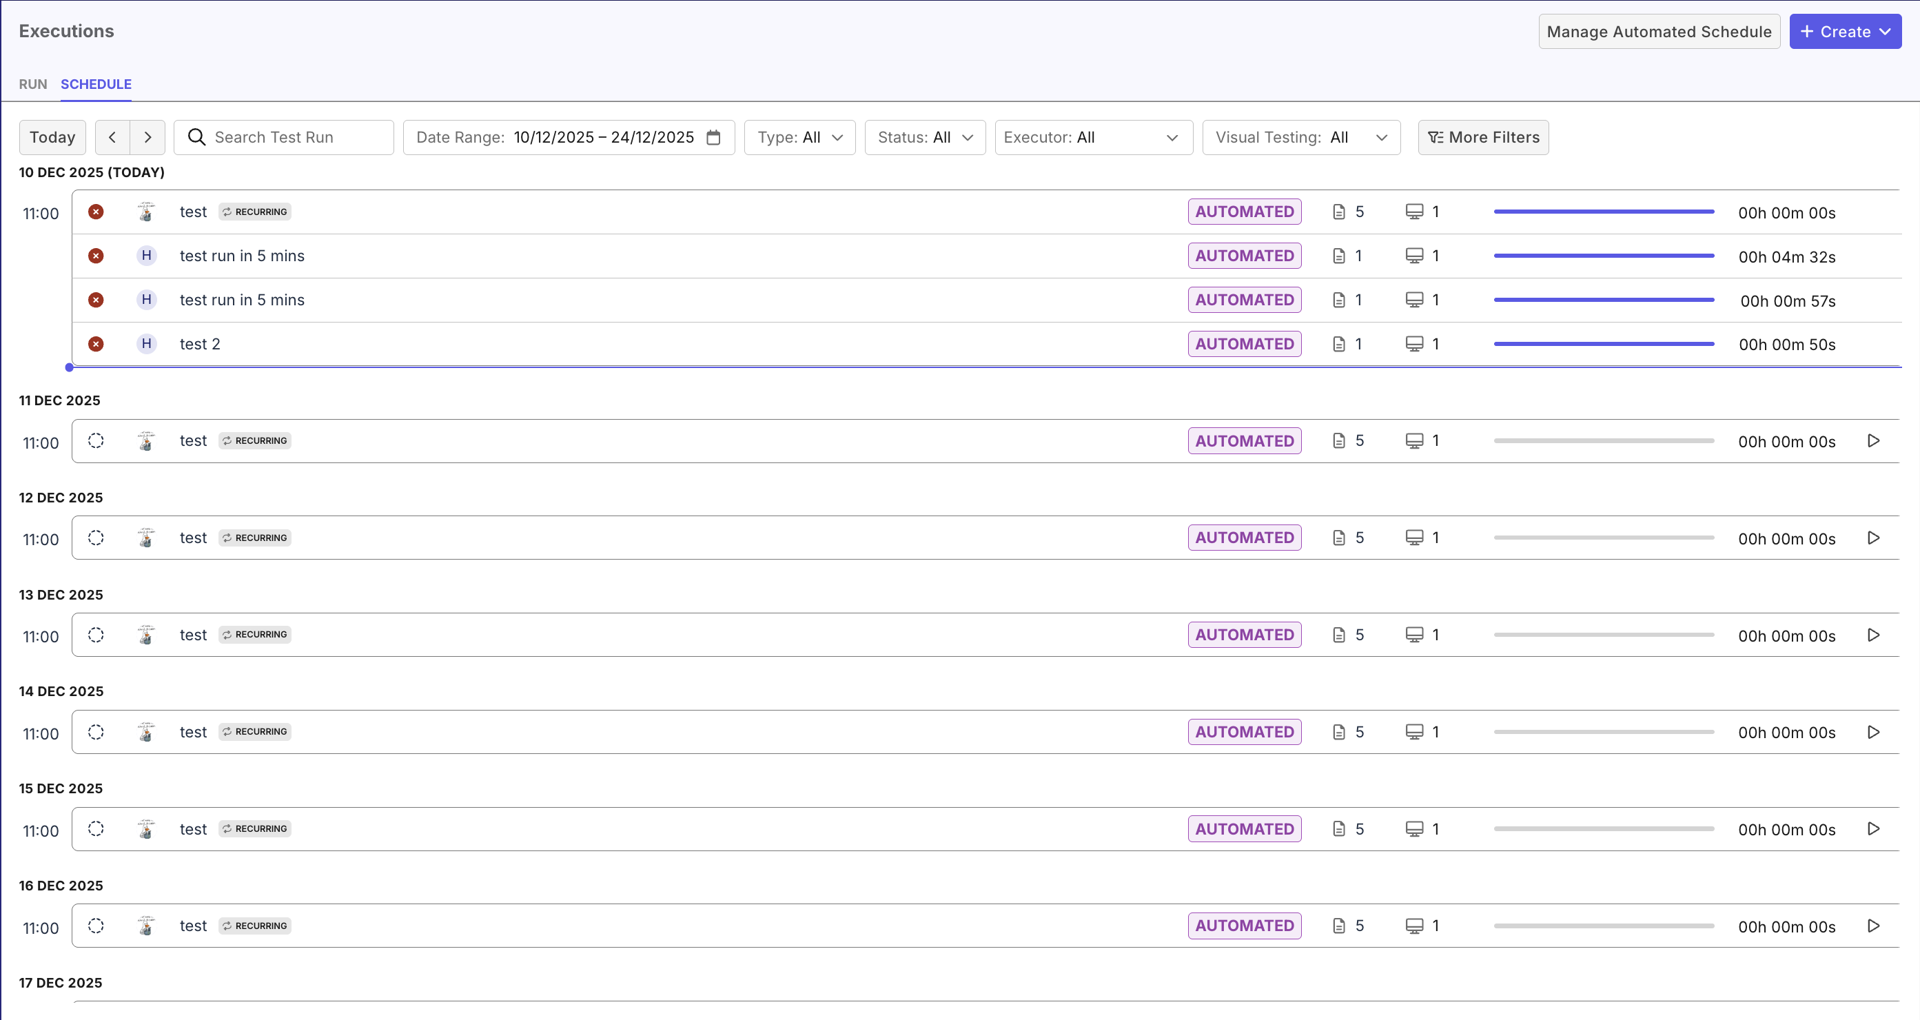
The Schedule tab displays scheduled tests, with sort/filters functions and an execute button next to each test so you can execute it immediately.
View Test Run details
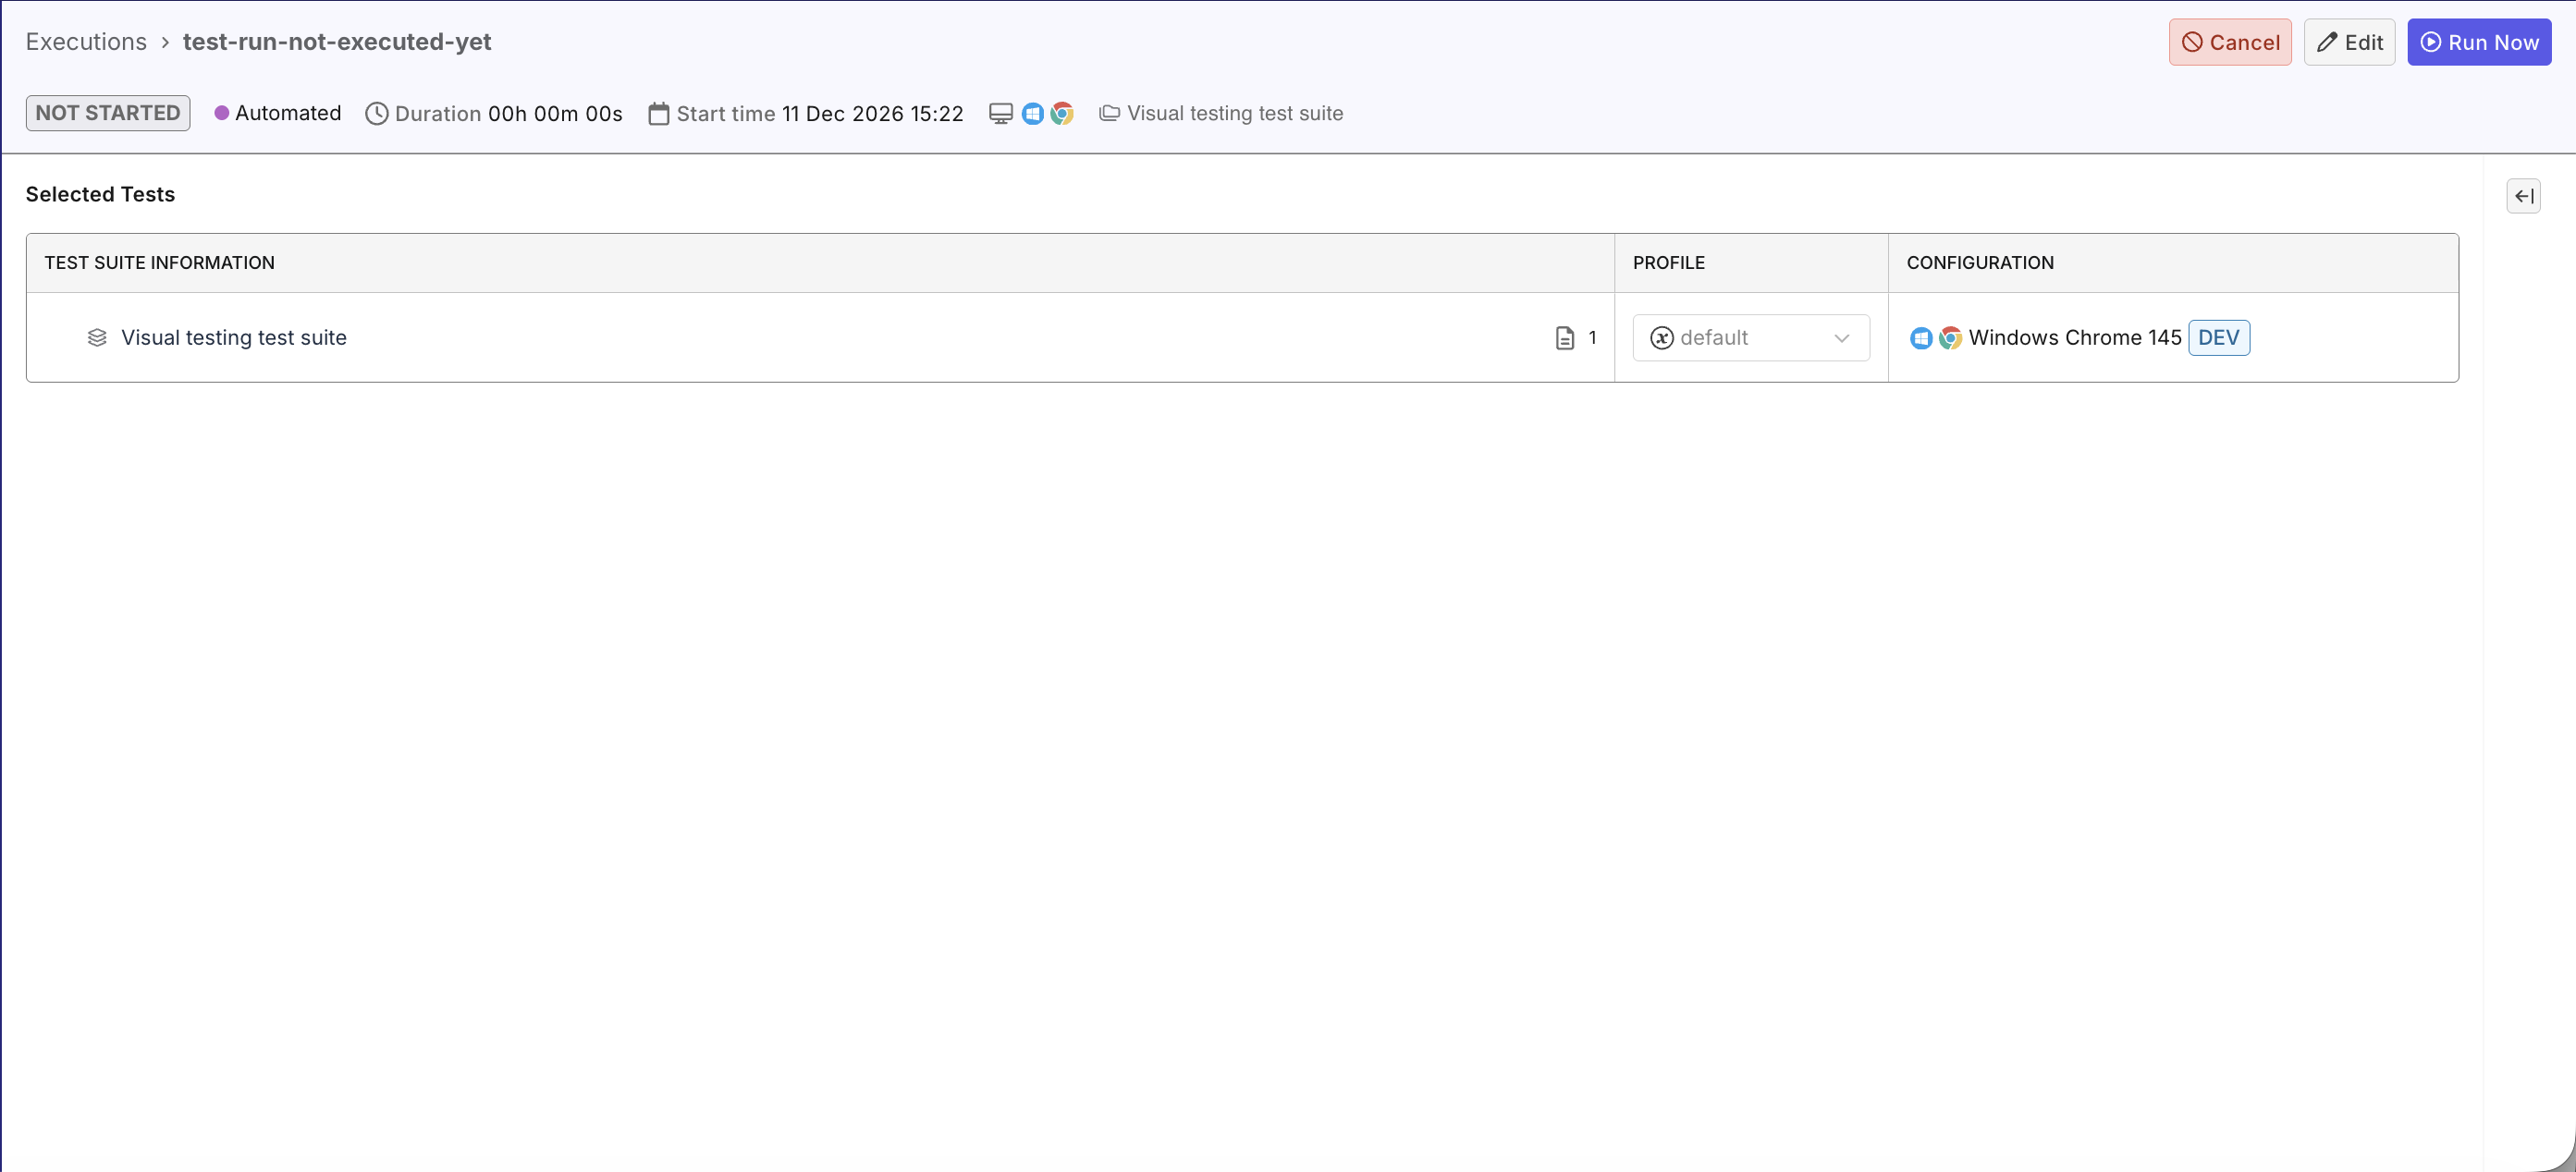
In Executions, click on a test run you want to assess to view its details. This view displays differently, depending on whether the test has been executed or not.
If the test is scheduled and never ran before, the view displays what test suites are selected, and allows you to Edit details, Run Now, or Cancel the run schedule. These actions are also available in the Manage Automated Schedule > Scheduled Test view.
- Manual Testing
- Automated Testing
Once the test completes, data are gathered to display in these tabs, to help you assess the test in its whole execution history:
-
Overview tab has charts to rate test suite’s performance over the runs:
-
Test Execution Results Distribution: percentages of test result statuses like passed, failed, skipped, etc.
-
Defects: List of defects linked to this test run. You can click each defect to view its full details in the ALM.
-
- Test Results tab has results of each test case in the test suites/test suite collections that this run contains. Each result can be view independently (see View Test Results details below).
- On each test run’s details page, Katalon True Platform includes only the data available up to the selected run. Any executions performed after that run are excluded, to maintain accurate and consistent analytics across all runs.
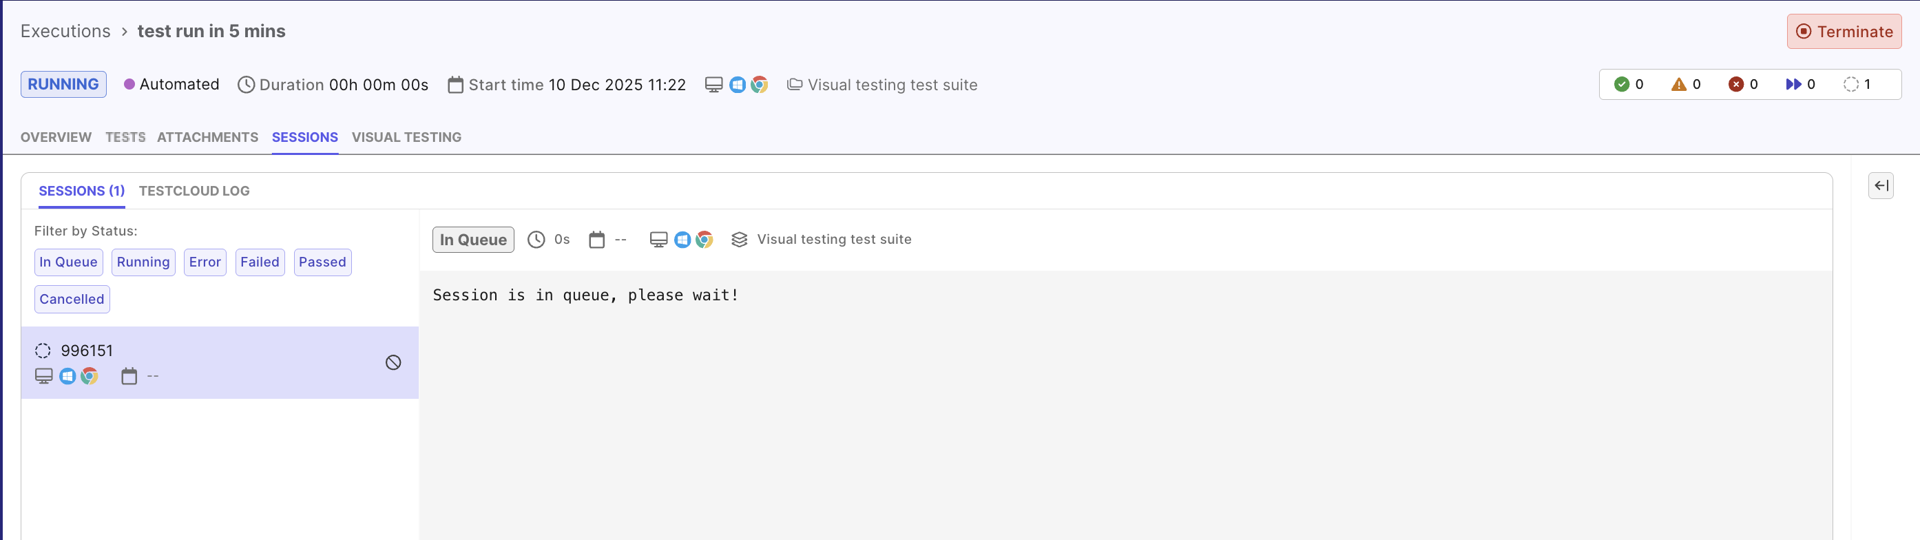
While the test is running, the view changes to display test run data. As this is the test's first run, most tabs are empty, except for the Sessions tab which displays real-time execution log as the test executes, for monitoring purposes.
Once the test completes, data are gathered to display in other tabs, to help you assess the test in its whole execution history:
-
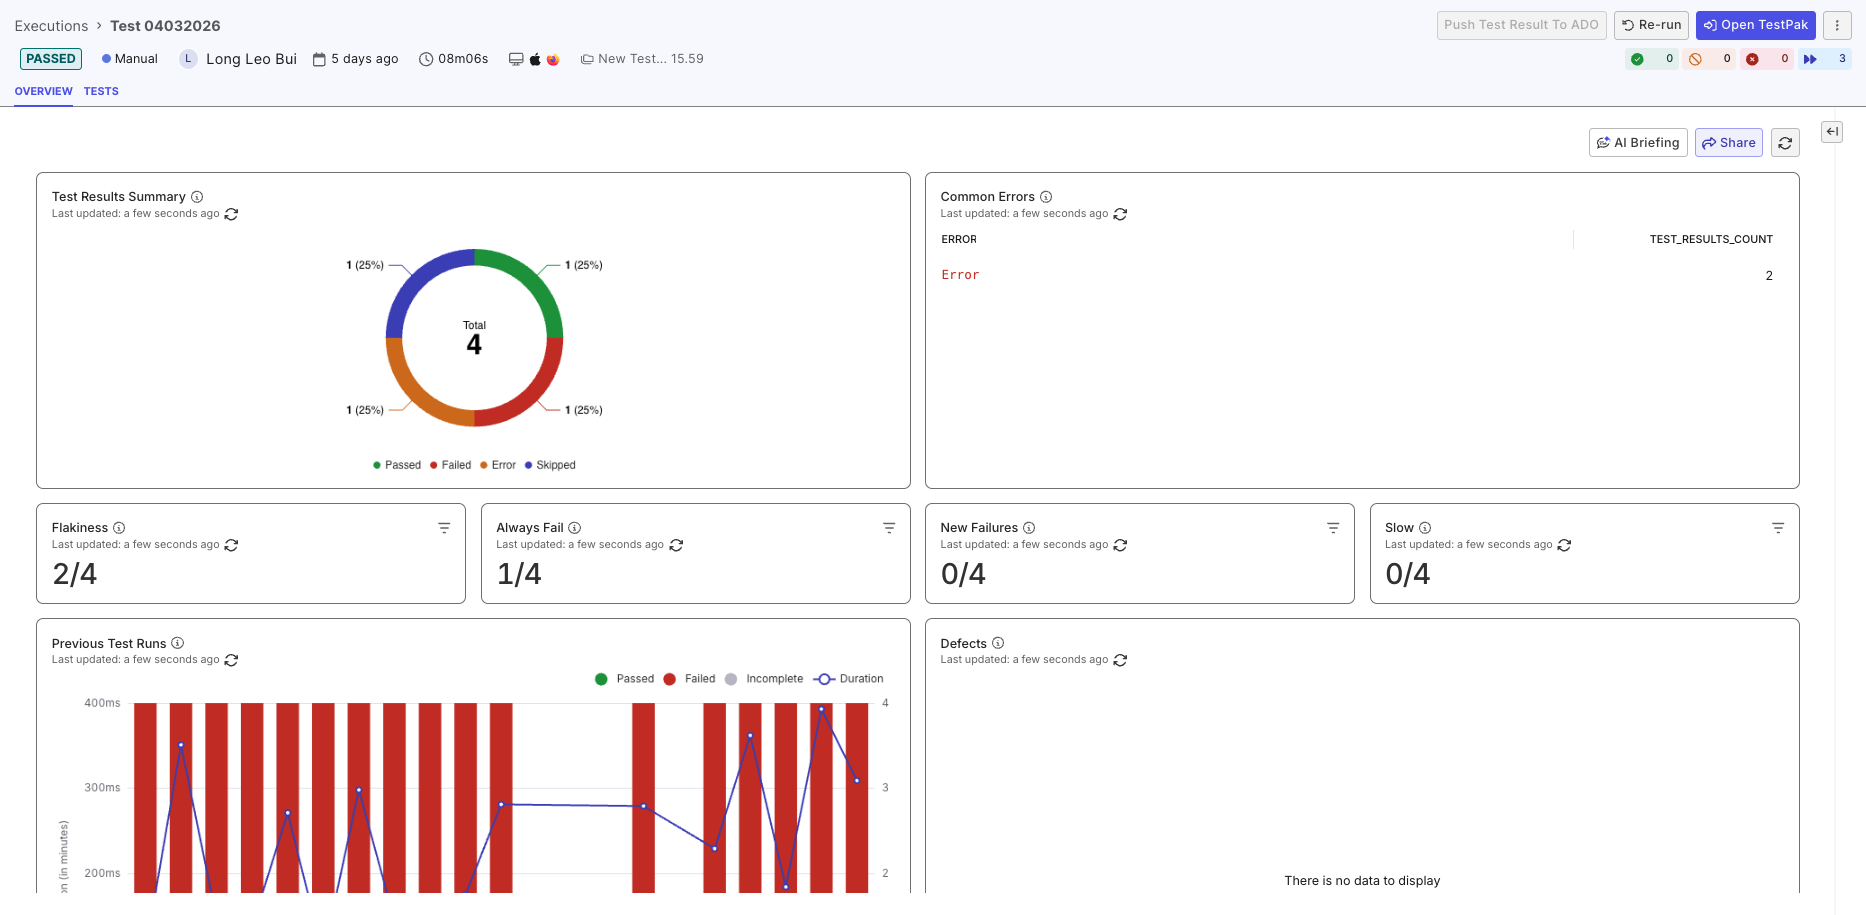
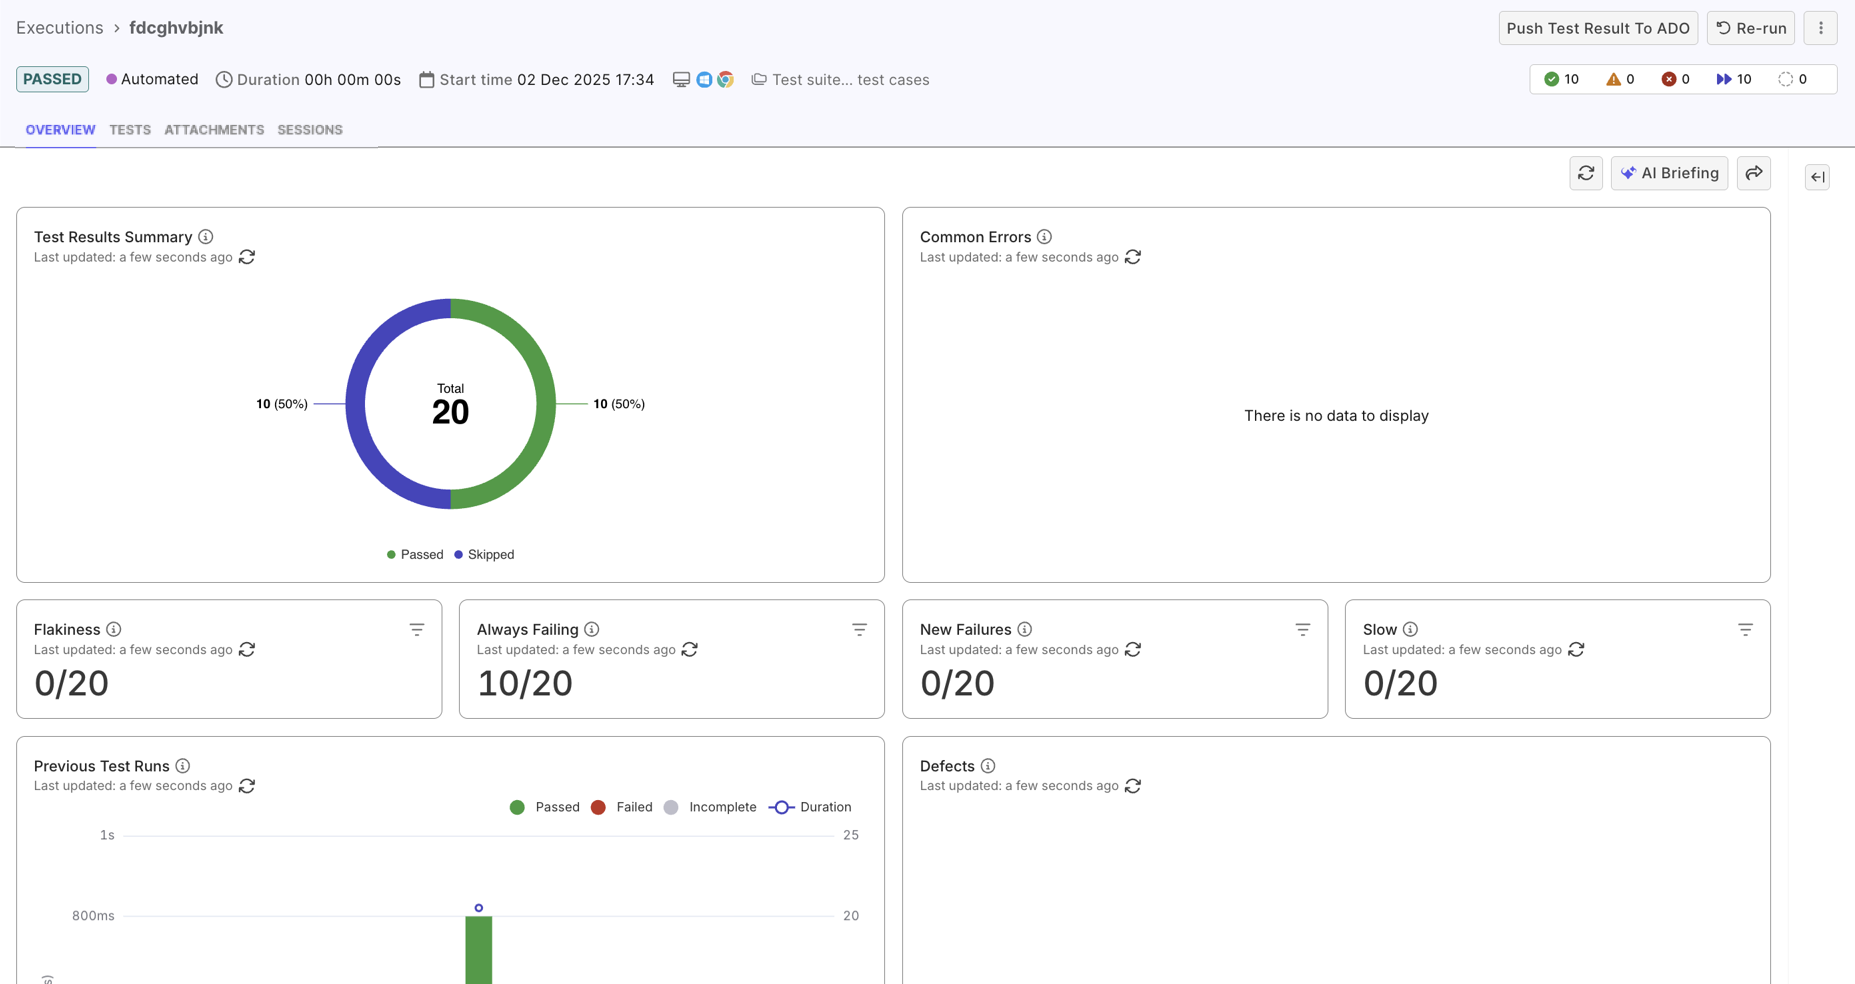
Overview tab has charts to rate test suite’s performance over the runs:
-
Test Results Summary: percentages of test result statuses like passed, failed, skipped, etc.
-
Common Errors: displaying common errors from failed tests. You can click each test to learn more.
-
Big numbers: Counts of smart tags like flaky, always fail, new failure, and slow.
-
Previous Test Runs: Past test runs with statuses and durations.
-
Defects: List of defects linked to this test run. You can click each defect to view its full details in the ALM.
-
Test Coverage by Configuration: Test execution coverage across operating systems and browsers.
-
Error Distribution by Failure Category: Details of test failures grouped by root cause category.
-
-
Attachments tab has attachments such as reports for later viewing.
-
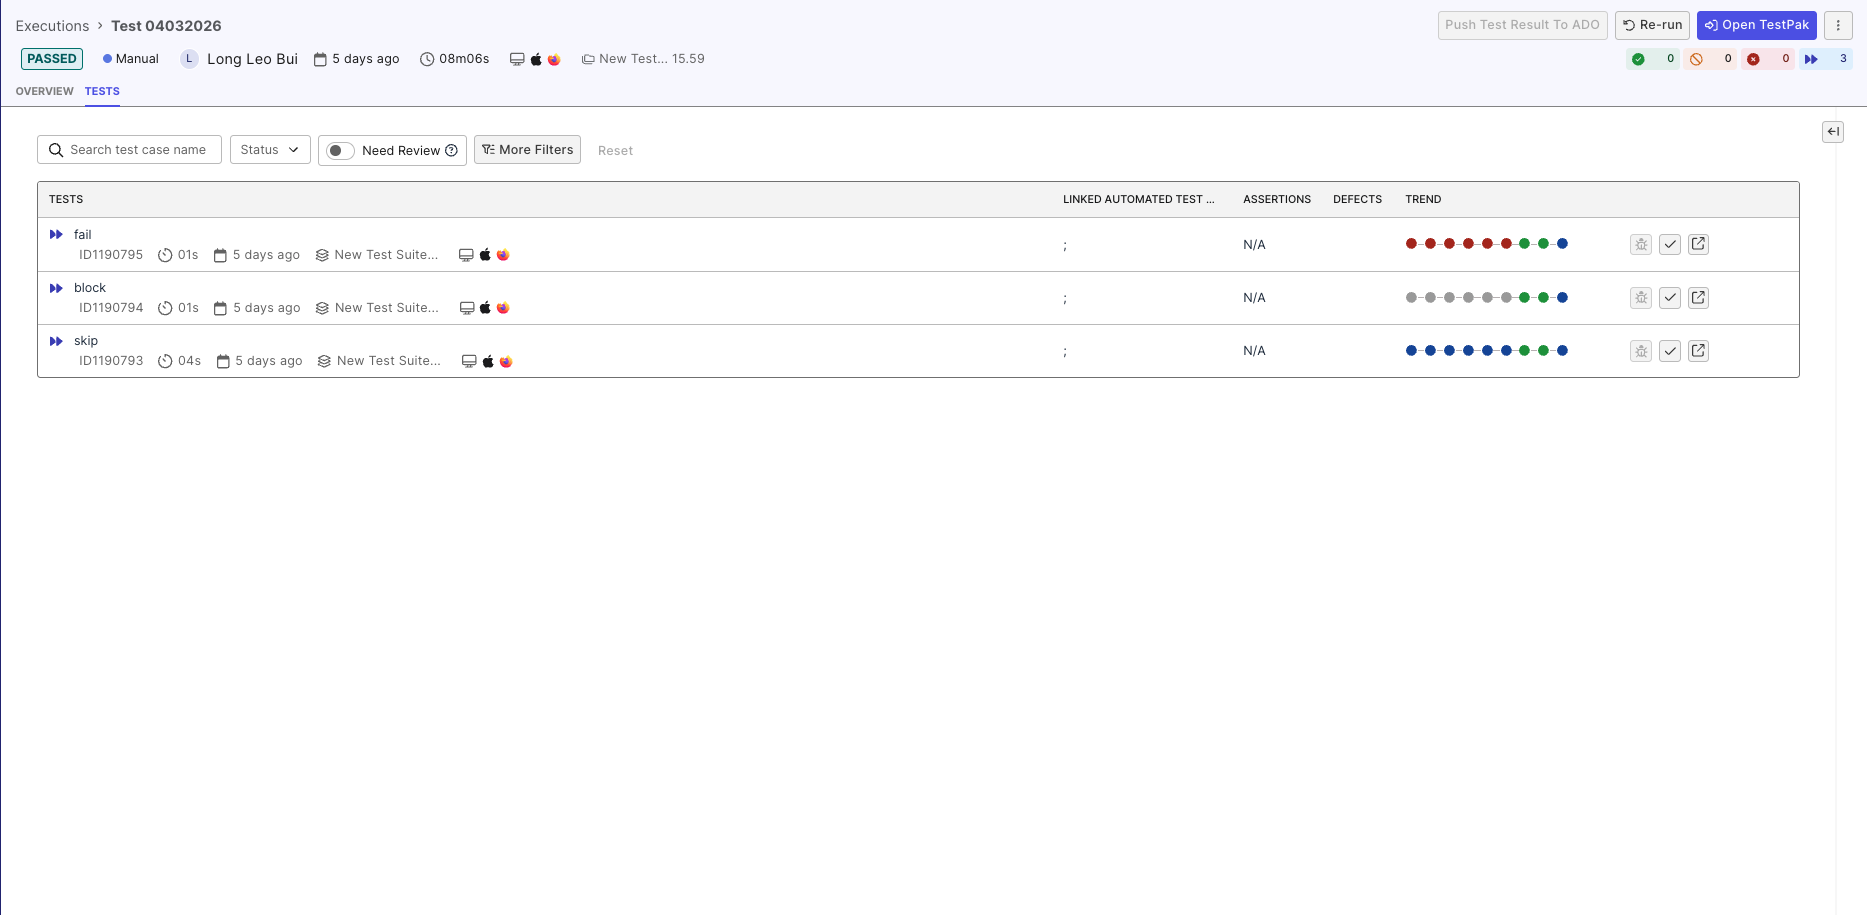
Tests tab has results of each test case in the test suites/test suite collections that this run contains. Each result can be view independently (see View Test Results details below).
-
Visual Testing tab has information of the Visual Testing, if enabled.
- On each test run’s details page, Katalon True Platform includes only the data available up to the selected run. Any executions performed after that run are excluded, to maintain accurate and consistent analytics across all runs.
- If you switch to the Test Results tab while a Dynamic Test Suite (DTS) is running, the tab may appear empty. This is because a DTS contains queries to select test cases, and does not contain test case data. After the test run completes, execution data will be parsed, and you can view the results as usual.
Test Report Options
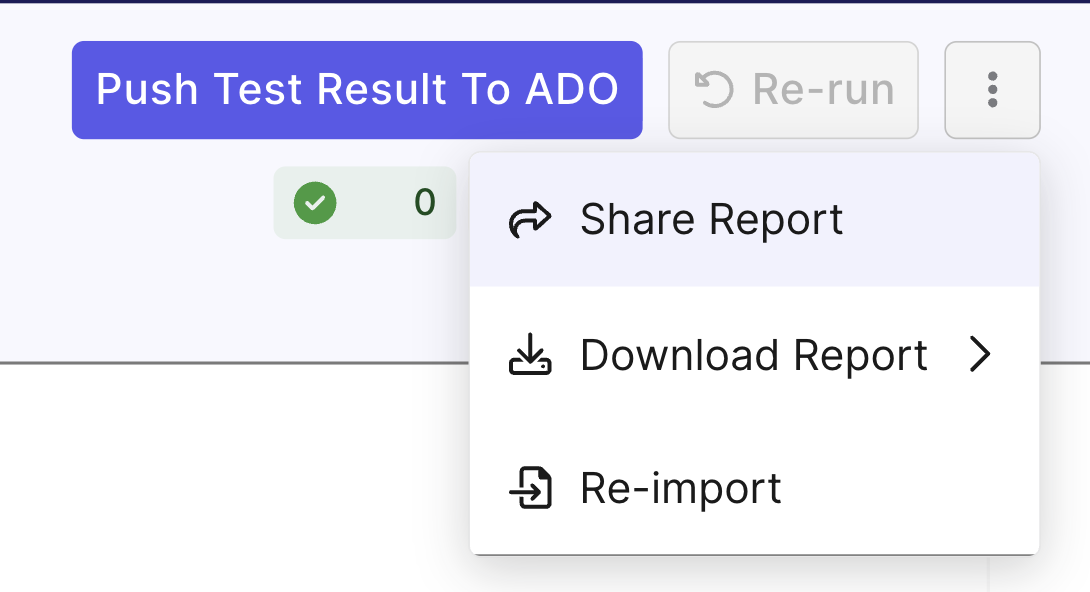
Explore test report options at the top right corner:
- Push Test Result to ADO: Push results in the current test run to Azure DevOps (ADO). This option requires integration to ADO.
- Share Report: Share by email.
- Re-import: If the test execution has finished but the report remains stuck at
Importing, you can manual force the report to re-import. - Download Report: Download for offline review or sharing. Available formats are
.csv,.xlsx,.pdf, and.zip.
View Test Result details
Use this view to quickly deep dive into each test case's log, and review execution issues.
-
In the Executions, select a test run to see the full Test Run Details page.
-
Select Test Results tab.
-
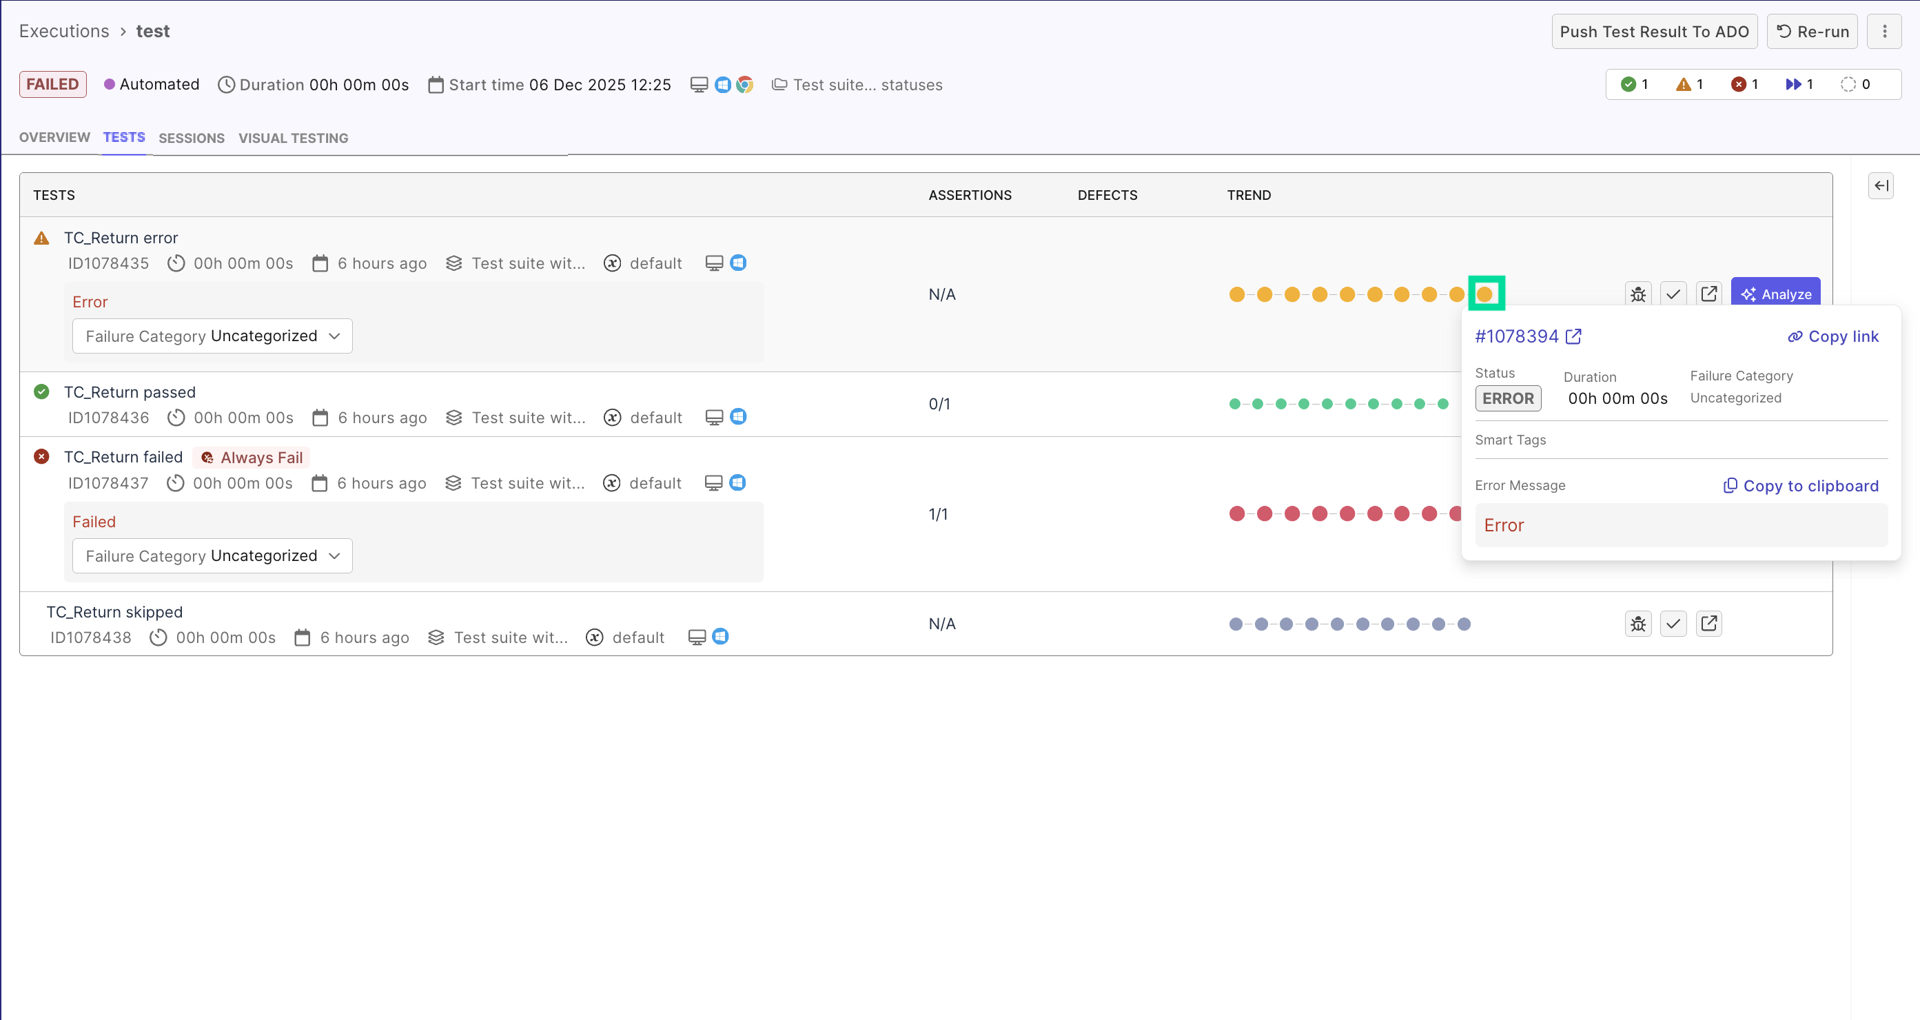
For each test case, click this button to view result of the current run.
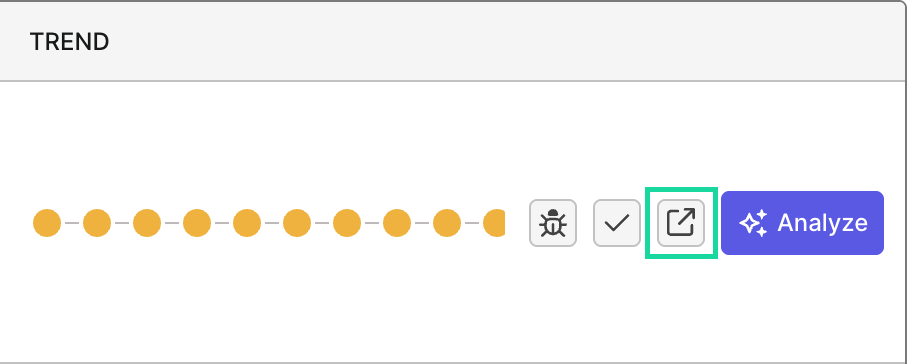
- The trend line displays most 10 recent runs of the test case, up until (and excluding) the current run, arranged from oldest (left) to most recent (right). Hover on each node to view details of any of these runs:
- Each test result details page displays details such as:
-
Test run configurations at the top.
-
Execution log with test step details.
-
Failure information (if the result is
failed) with category and, and the similar failures button that redirects you to a failure report filtered by the current failure's category. -
Stability trend line with history of past runs. You can hover on each node to view details of each run's result.
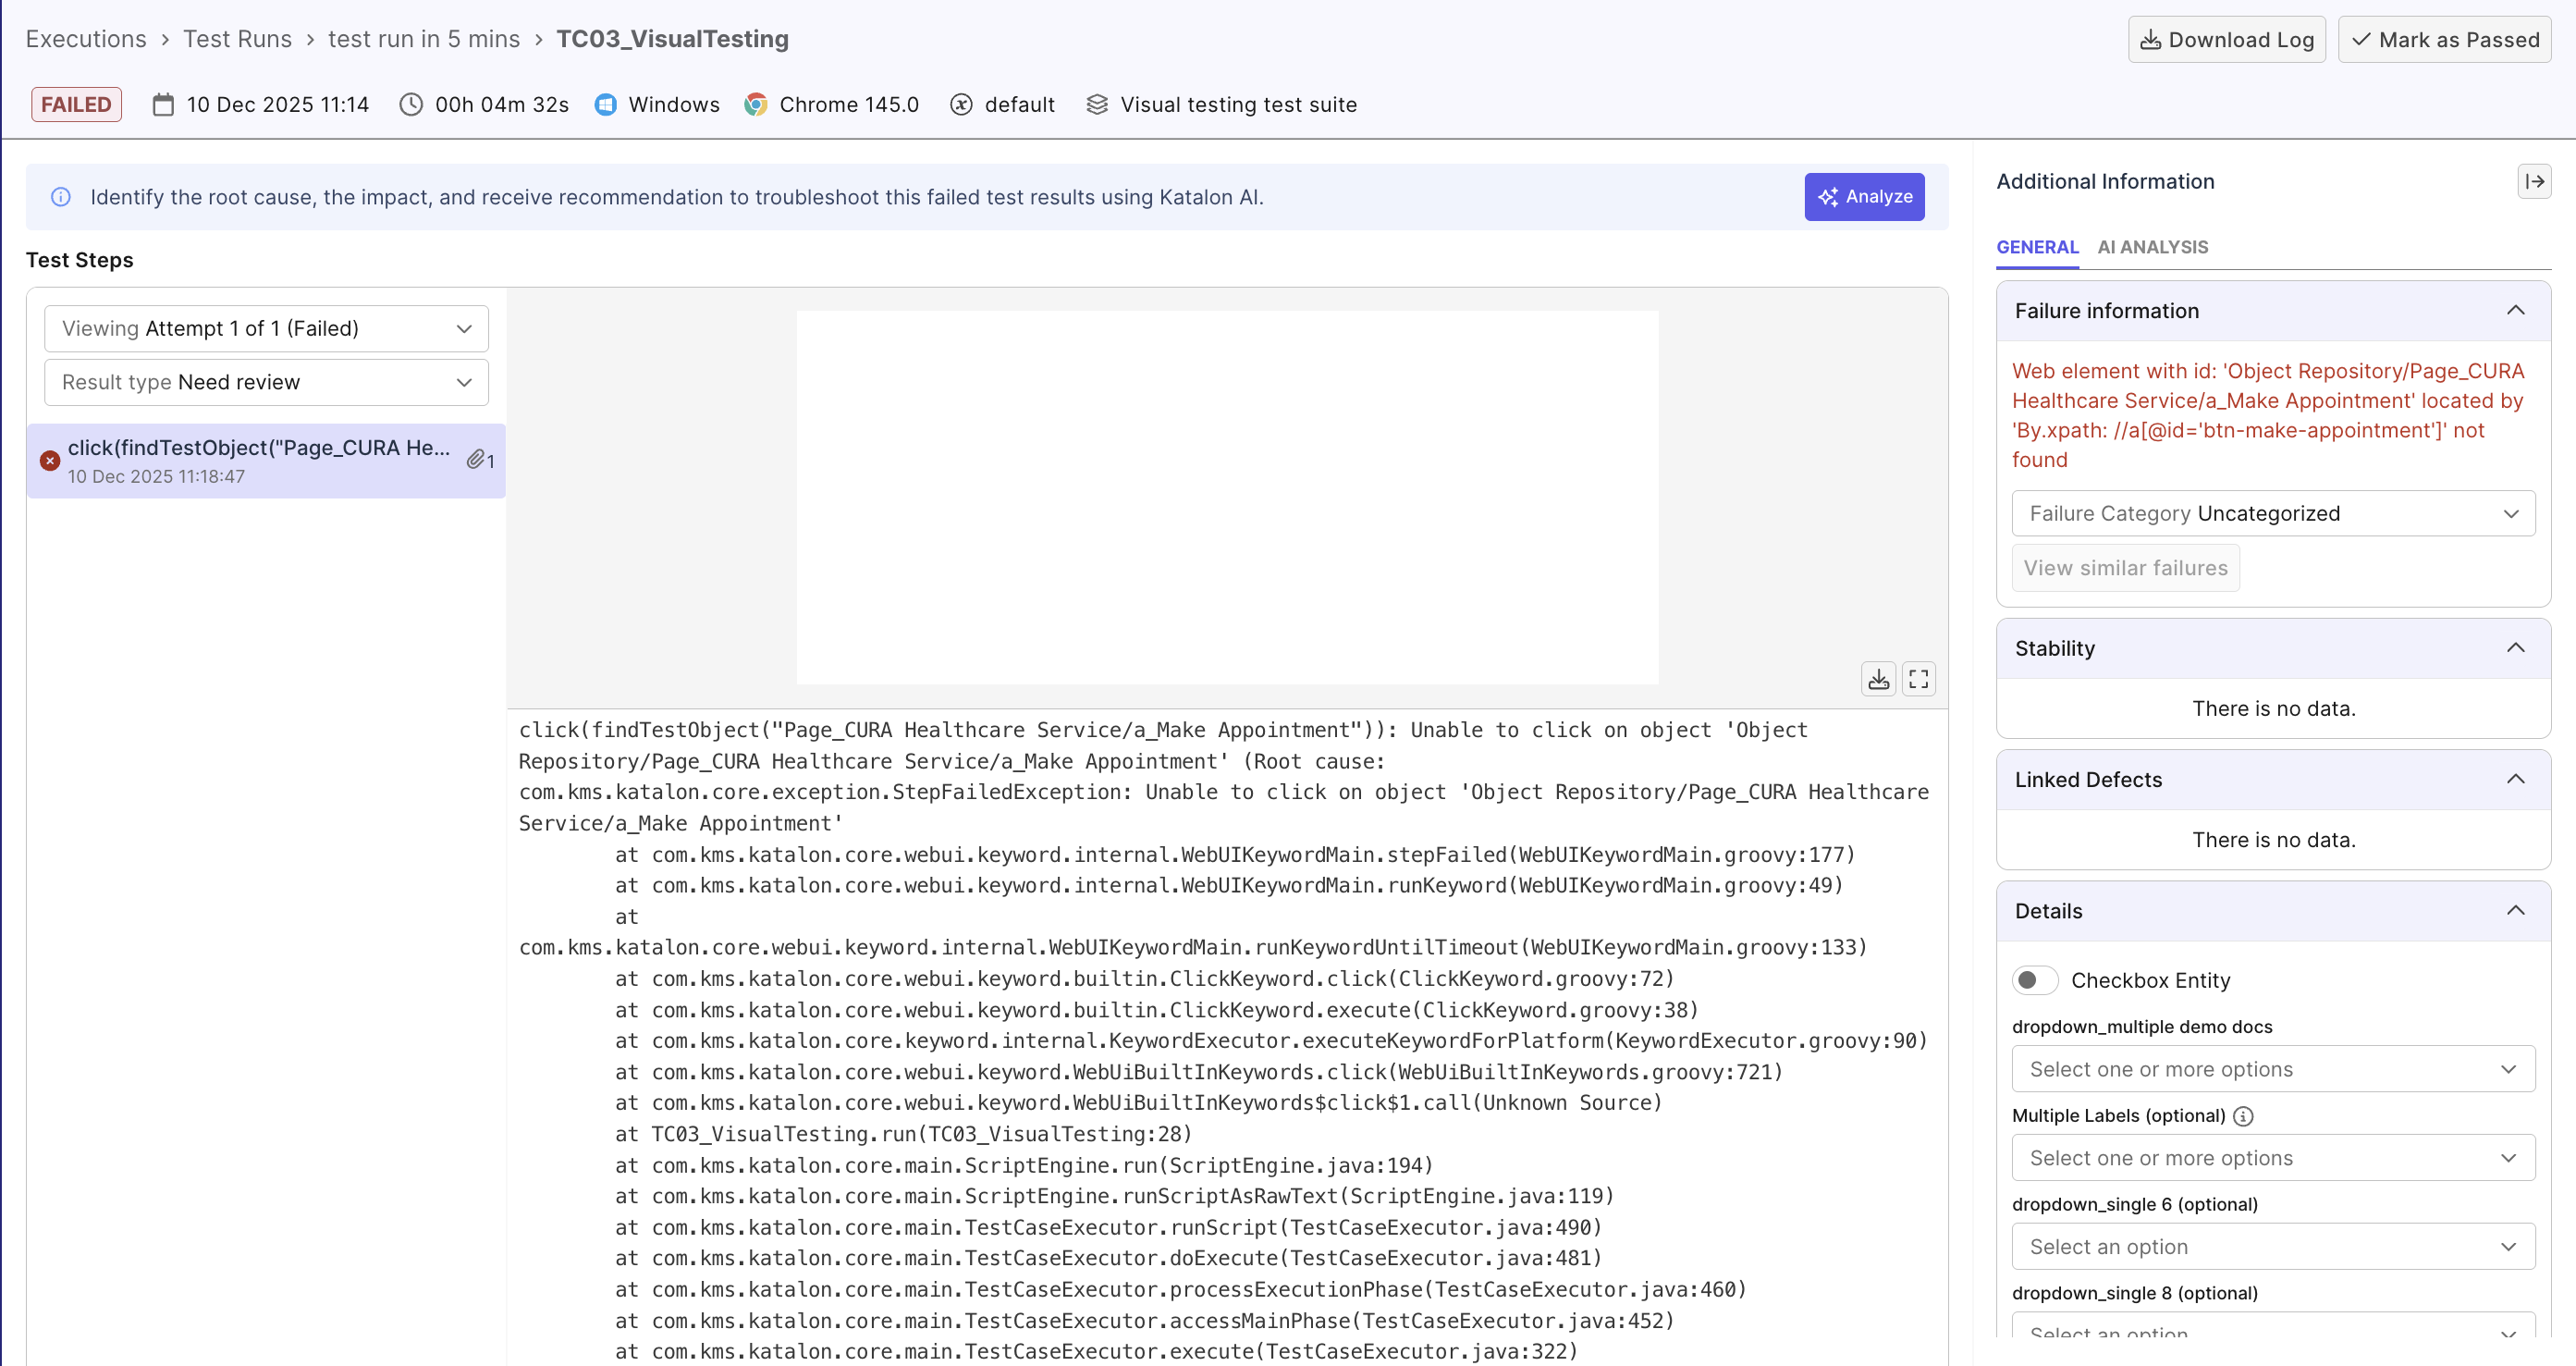
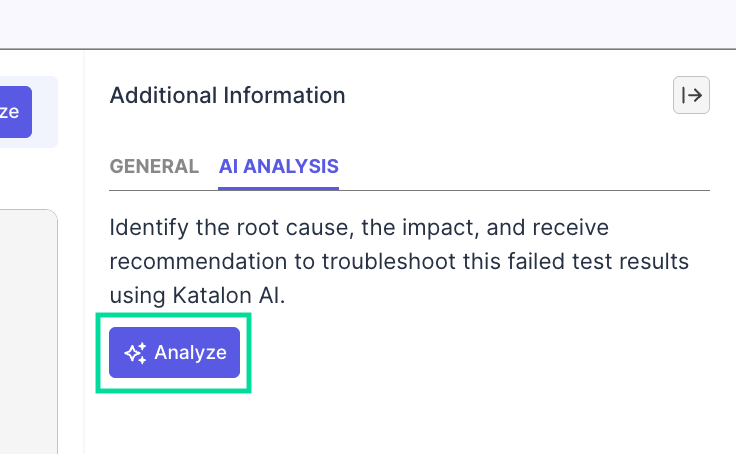
You can switch to AI-analysis tab (failed results only), to have Katalon's AI analyze the root cause, impact, and recommendation to troubleshoot this failure:
For each test case, Katalon True Platform does calculations in the background and displays at the test case level, so you can quickly identify problematic tests. Hovering on each label shows more details, and how smart tags are calculated. See Smart Tags for more details on smart tags.