Configuration Coverage Report
Last updated: April 2026
This document lists features of the Configuration Coverage Report.
The Configuration Coverage Report helps QA teams quickly visualize configuration coverage trends and spot coverage gaps to make informed decisions about where to focus additional testings.
Tutorial: Analyze configuration coverage
Report Features
Dynamic Filters
- Filters allow you to refine report data by time range (or release/sprint), execution type, and grouping criteria.
- Default grouping is by OS Name, but you can switch to Browser Name or OS & Browser for deeper analysis.
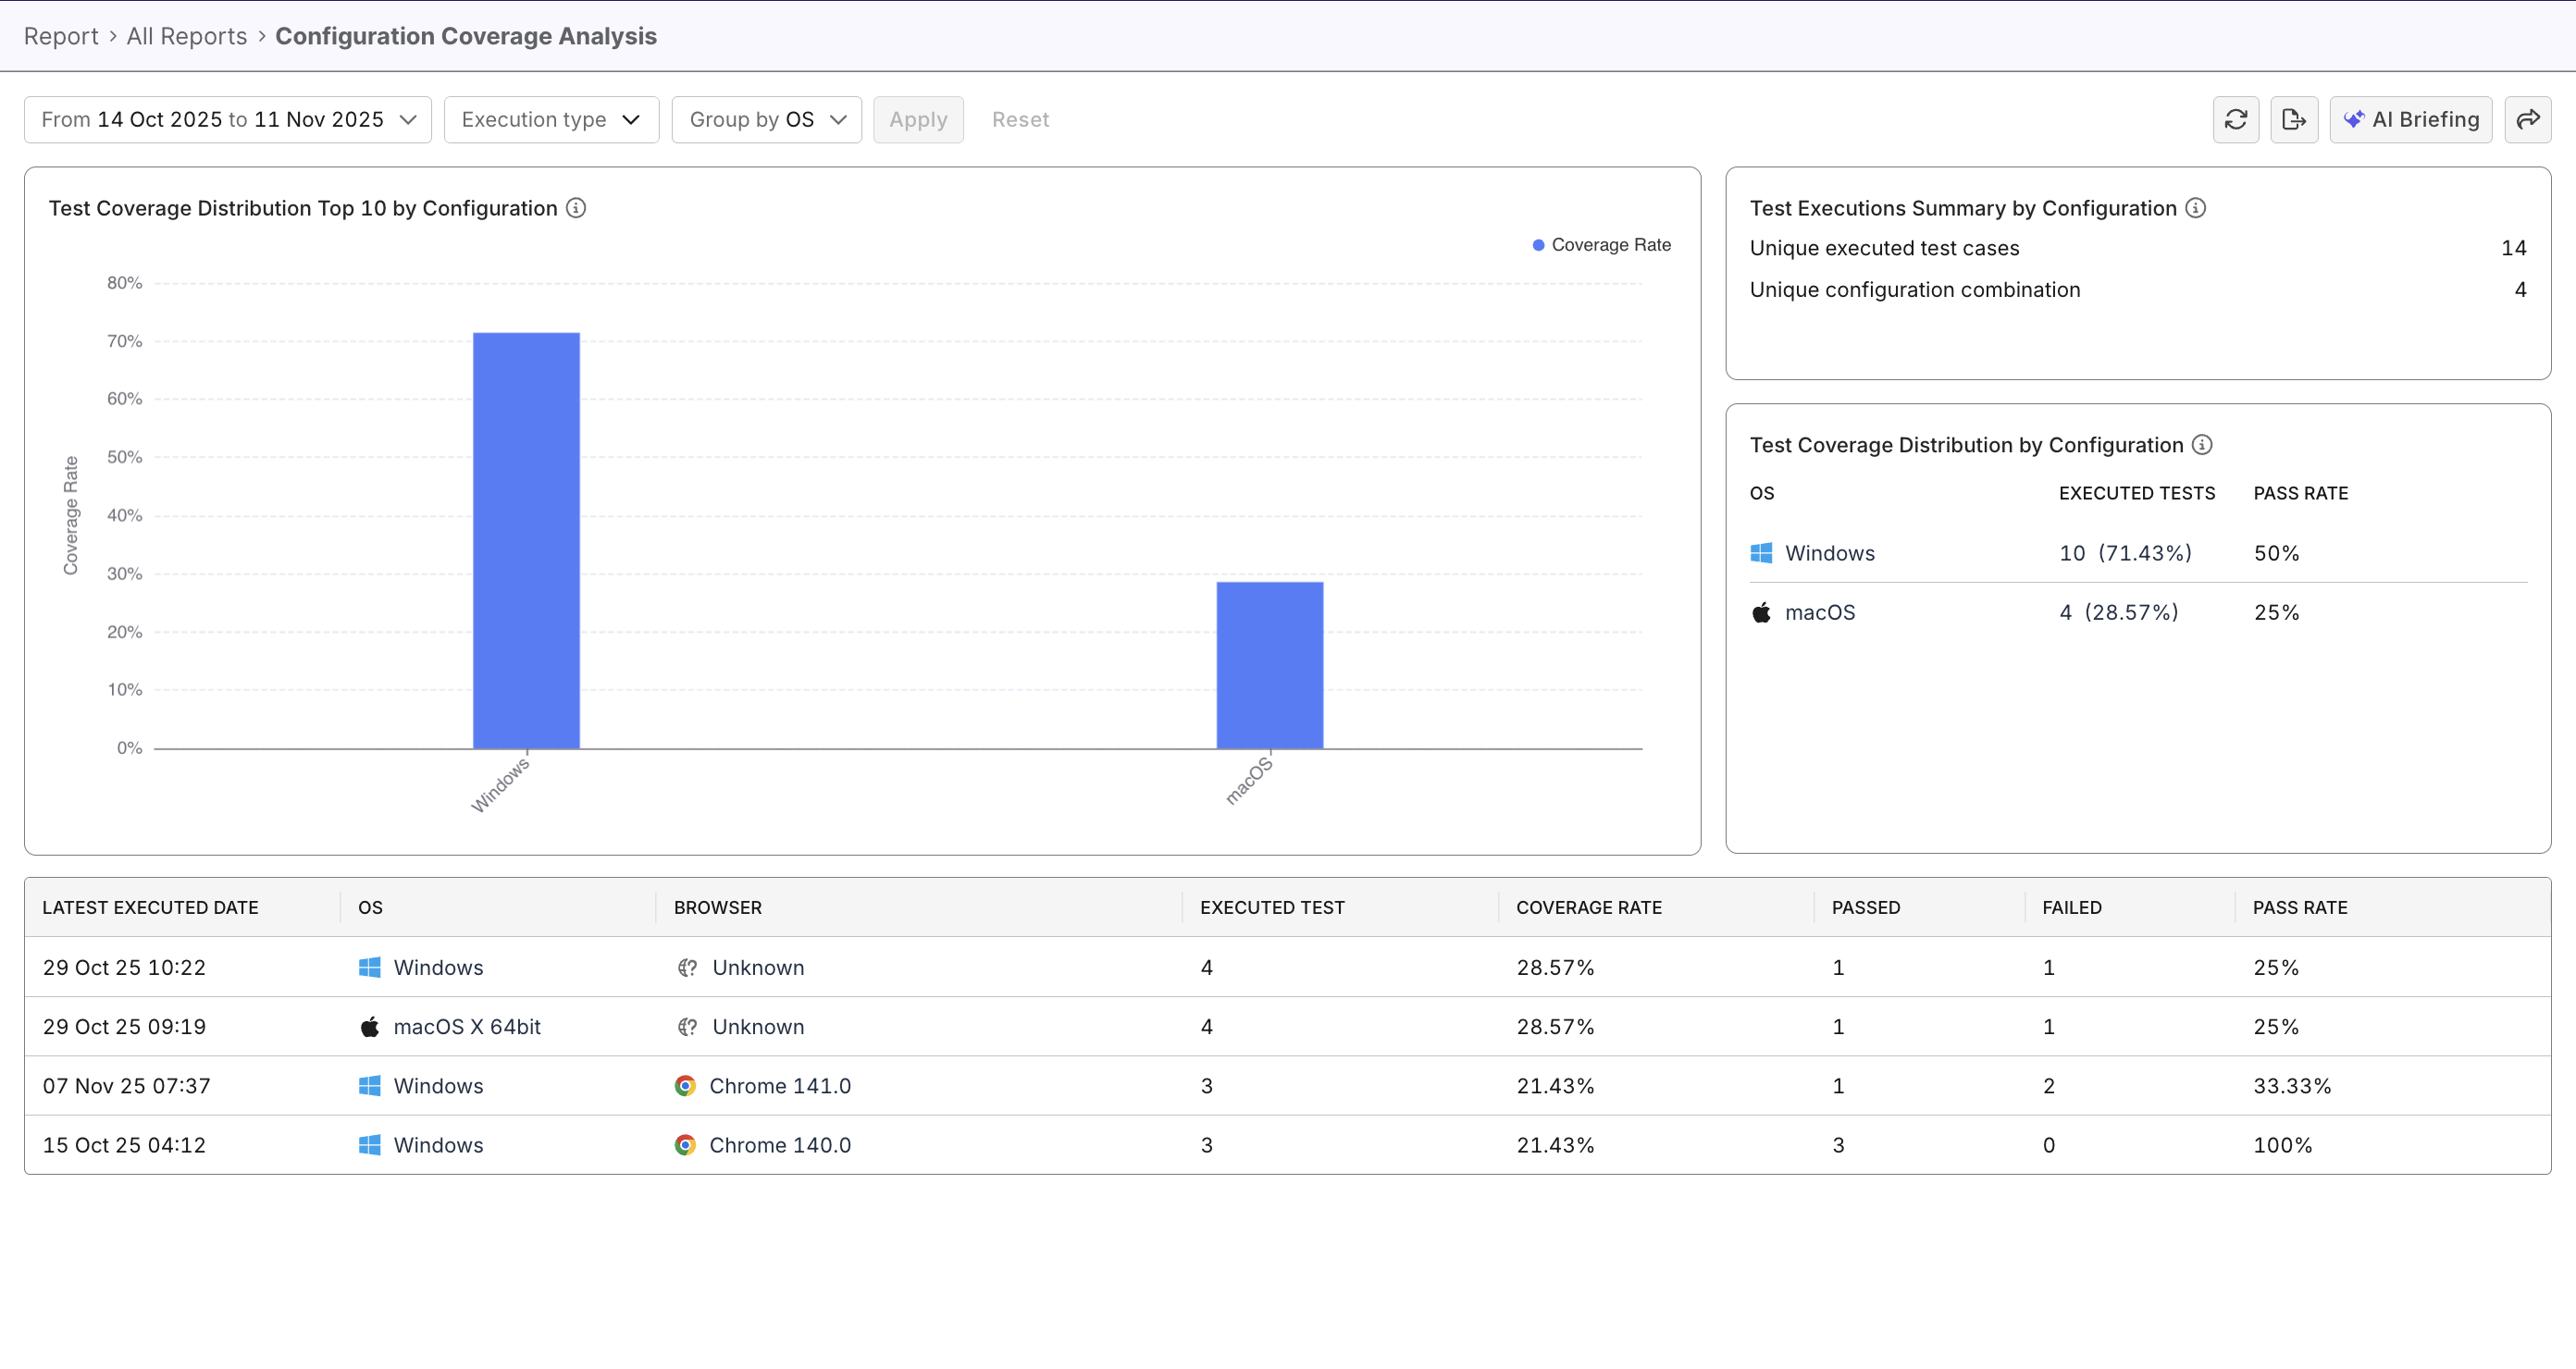
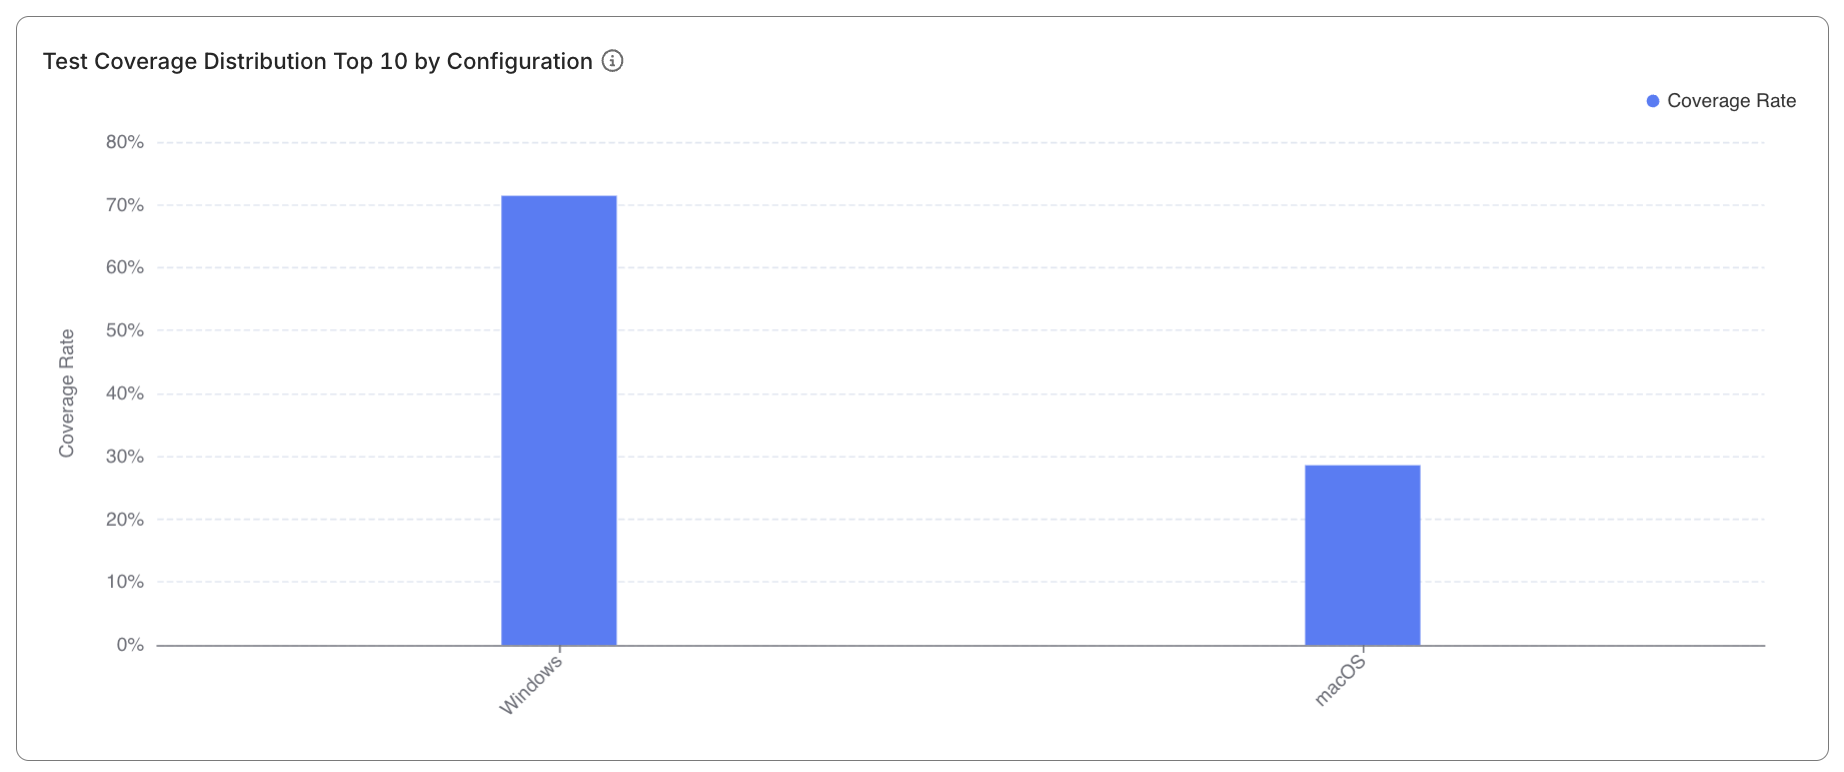
Test Coverage Distribution Top 10 by Configuration
- Displays a bar chart, with each bar representing a configuration’s coverage percentage.
- Maximum of 15 configurations shown, sorted by coverage in descending order.
- Hovering on each bar reveals configuration names and percentages; clicking filters the data table below.
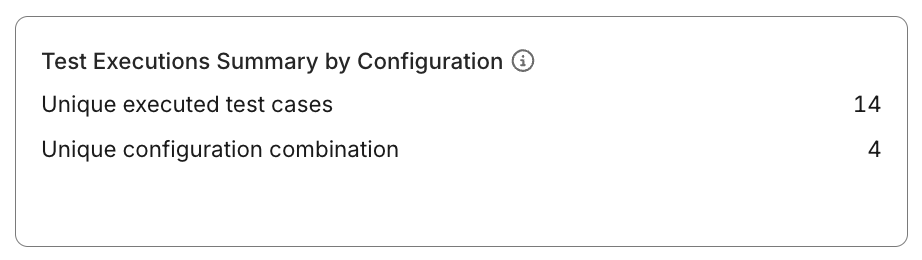
Test Executions Summary by Configuration
This widget is a table that:
- Shows aggregate counts of unique executed test cases and unique configuration combinations (UCC) in the selected period.
- Provides a quick snapshot of test breadth across environments.
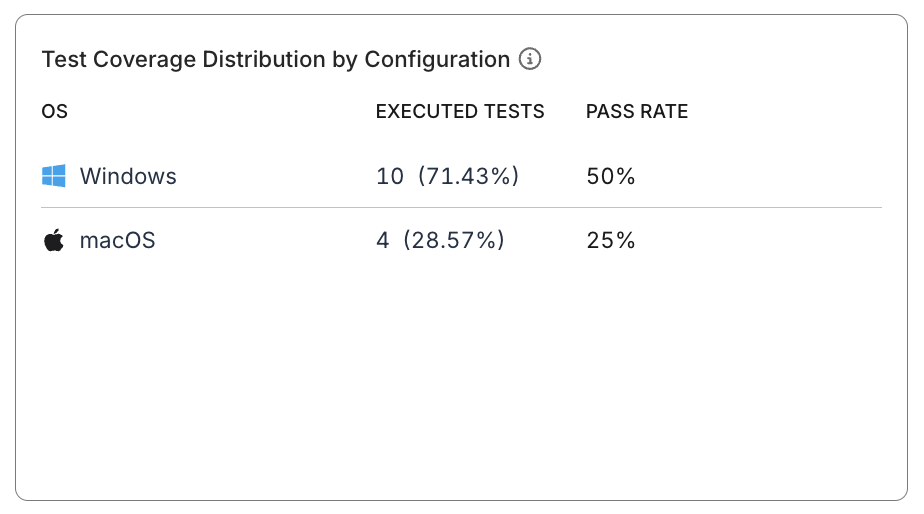
Test Coverage Distribution by Configuration
- Ranks UCC by coverage rate.
- Paginated, displaying 8 entries per page.
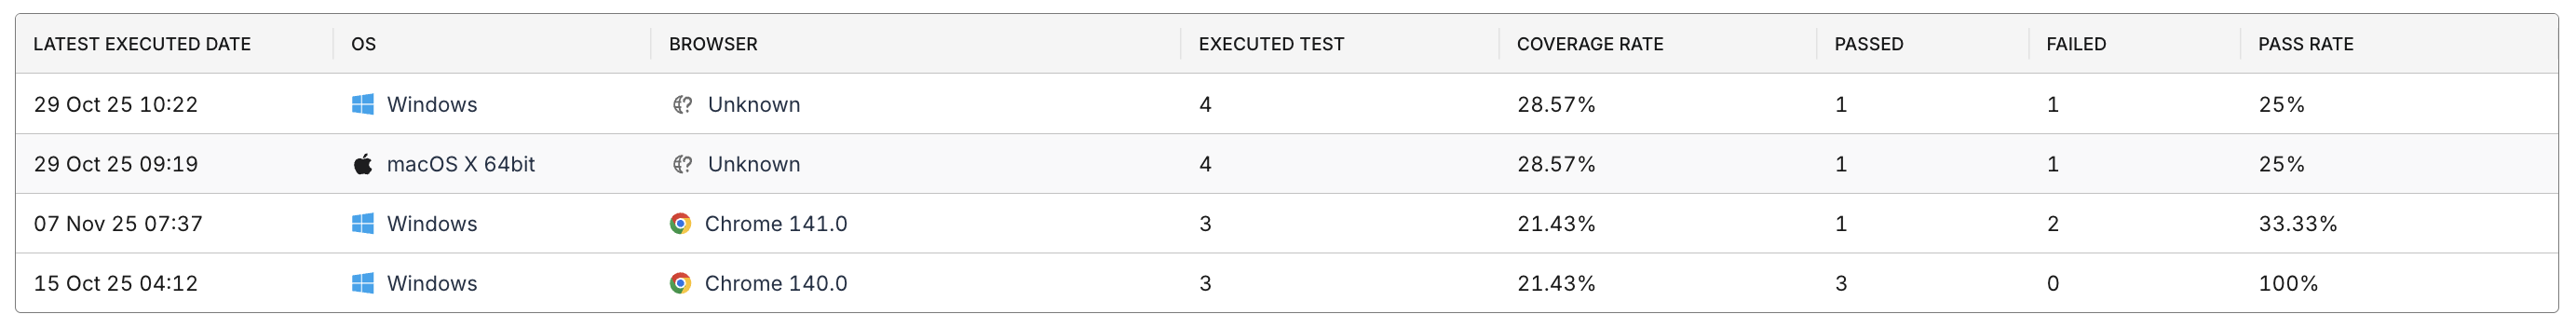
Data Table
- Presents sortable and filterable records with the following columns:
- Lastest executed date
- OS (icon & name)
- Browser (icon & name). Undetectable browser is labeled "Unknown".
- Executed test cases
- Number of Passed/Failed test cases and calculated pass rate
- Coverage Rate
- By default, data is sorted by Coverage Rate (Descending).
Coverage Calculation Rules:
                 Executed Unique Test Cases per UCC (OS + Browser)
Coverage Rate = ------------------------------------------------------------- × 100%
                                  Total Unique Test Cases
            Passed Unique Executed Test Cases per UCC (OS + Browser)
Pass Rate = --------------------------------------------------------- × 100%
             Total Unique Executed Test Cases per UCC (OS + Browser)