Defects Activity Analysis Report
This document lists features of the Defects Activity Analysis Report.
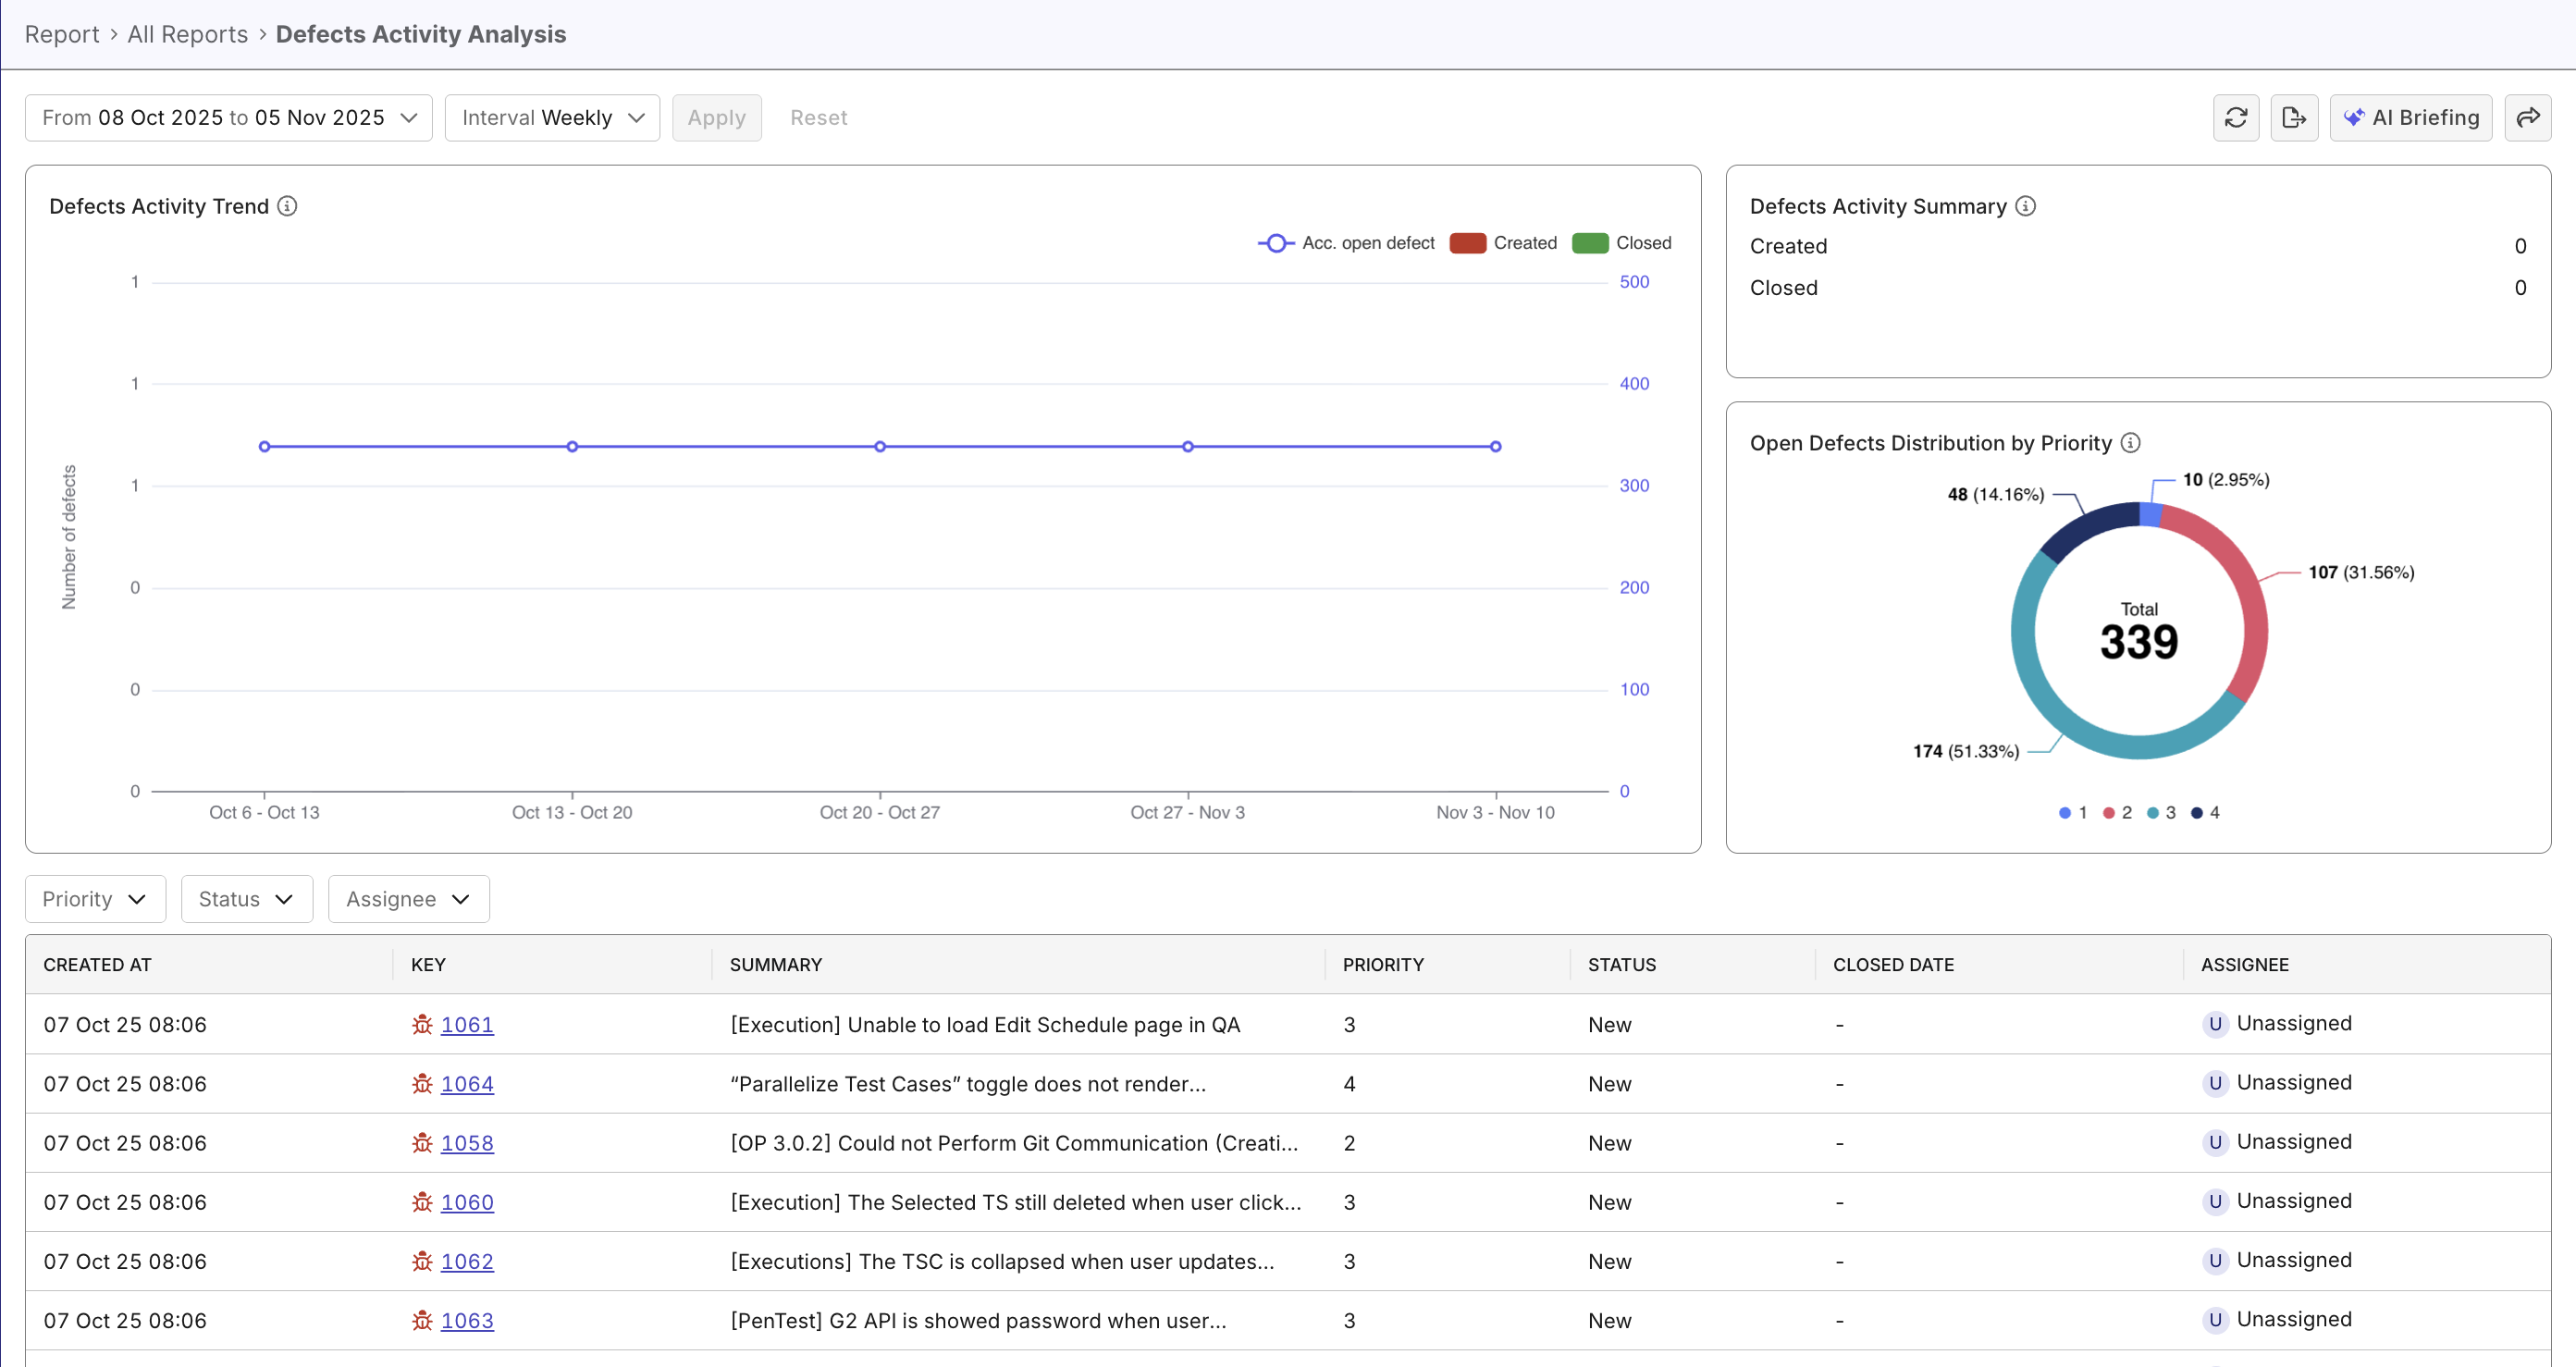
The Defects Activity Analysis Report provides a clear, time-based view of defect creation, closure, and accumulation trends across a selected period.
It helps QA and development teams track defect dynamics, identify backlog growth, and evaluate resolution performance over time.
Tutorial: View defect trends
Report Features
The Defects Activity Analysis Report includes multiple visual components and metrics to help you analyze defect trends comprehensively.
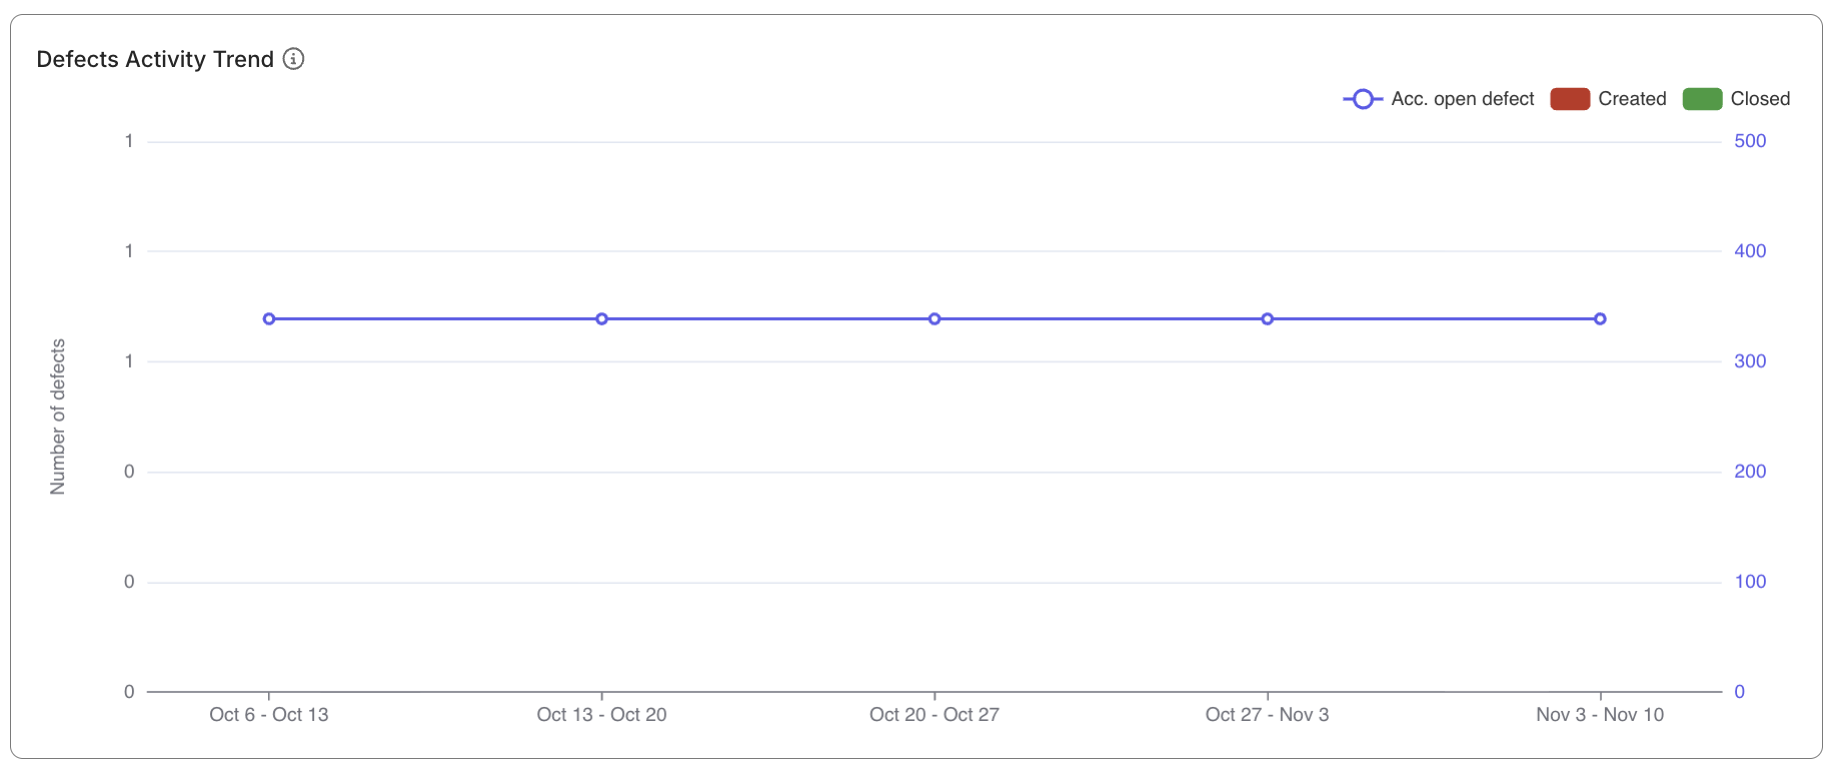
Defects Activity Trend widget
A hybrid stacked bar and line chart that visualizes:
- Accumulated open defects: Active unresolved defects carried over time. It counts defects with
created_atdate within selected scope (time/iteration) and undefinedresolved_at. - Created defects: Number of defects created during the selected time period. It counts defects with
created_atdate within selected scope (time/iteration). - Closed defects: Number of defects resolved during the selected time period. It counts defects with
resolved_atdate within selected scope (time/iteration).
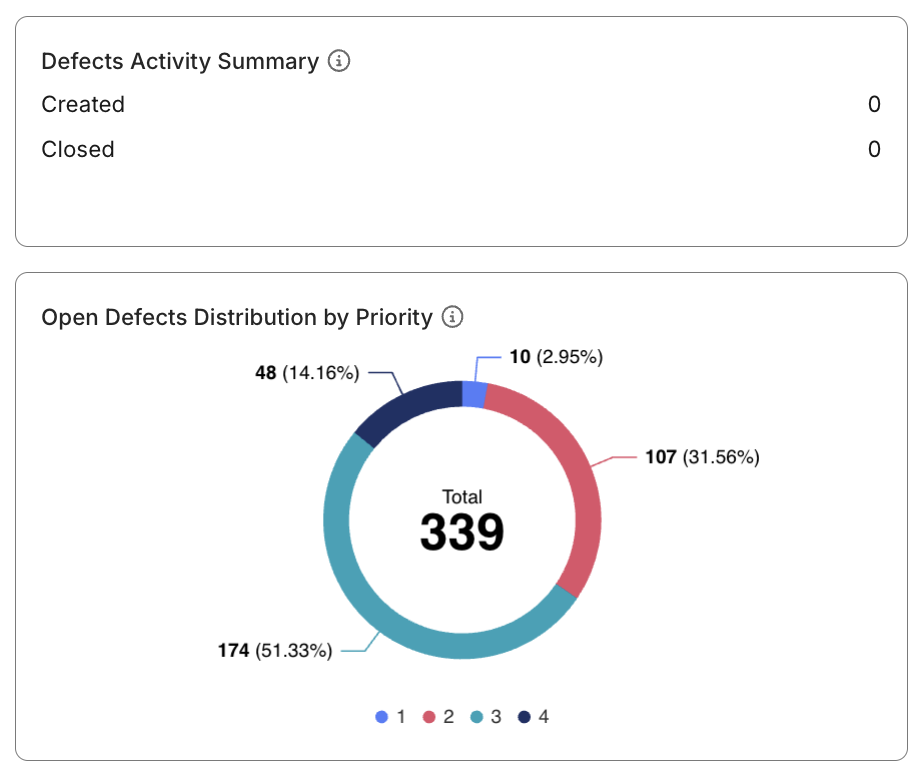
Defects Activity Summary widget
A set of snapshot metrics summarizing total created and closed defects for the selected period.
These KPIs provide an at-a-glance view of current defect handling performance.
Open Defects Distribution by Priority widget
Displays the proportion of defects by priority level (P1–P3). This chart helps highlight the concentration of critical or high-severity issues.
Defect priority/severity are Katalon True Platform's native terms, not your ALM tool's. Configure mapping between the terms when configuring your ALM tools.
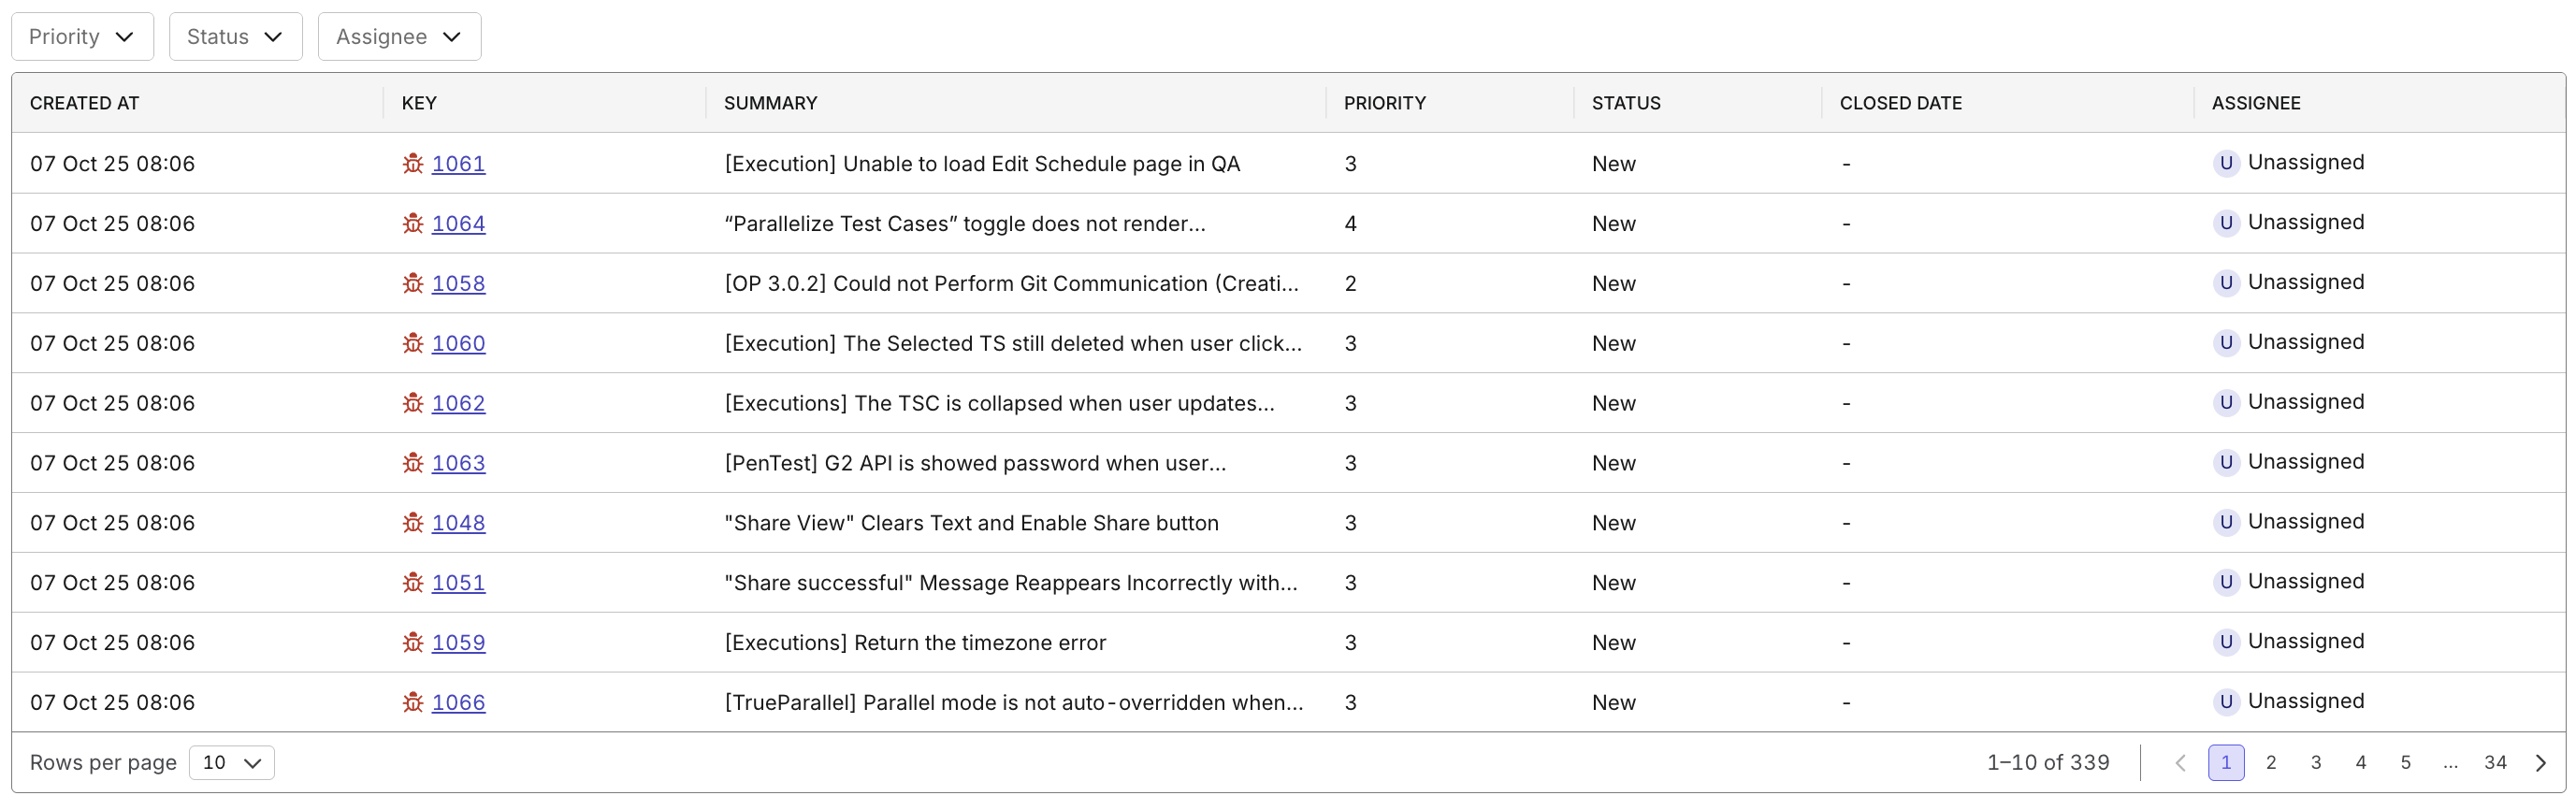
Defect Drill-down Table
A detailed table listing all defect records that appear in the visualizations.
Each entry includes key fields such as:
- Created At
- Key (Defect ID)
- Summary
- Priority
- Status
- Closed Date
- Assignee
You can click on any Defect Key to open details, assign owners, or escalate critical items.