Defect Status Analysis Report
Last updated: April 2026
This document lists features of the Defect Status Analysis Report.
The Defect Status Analysis Report helps teams monitor, analyze, and manage defect trends across projects. It provides an immediate understanding of defect distribution, by severity, priority, and resolution state, without the need to manually compile data.
Tutorial: Analyze defect status
Report Features
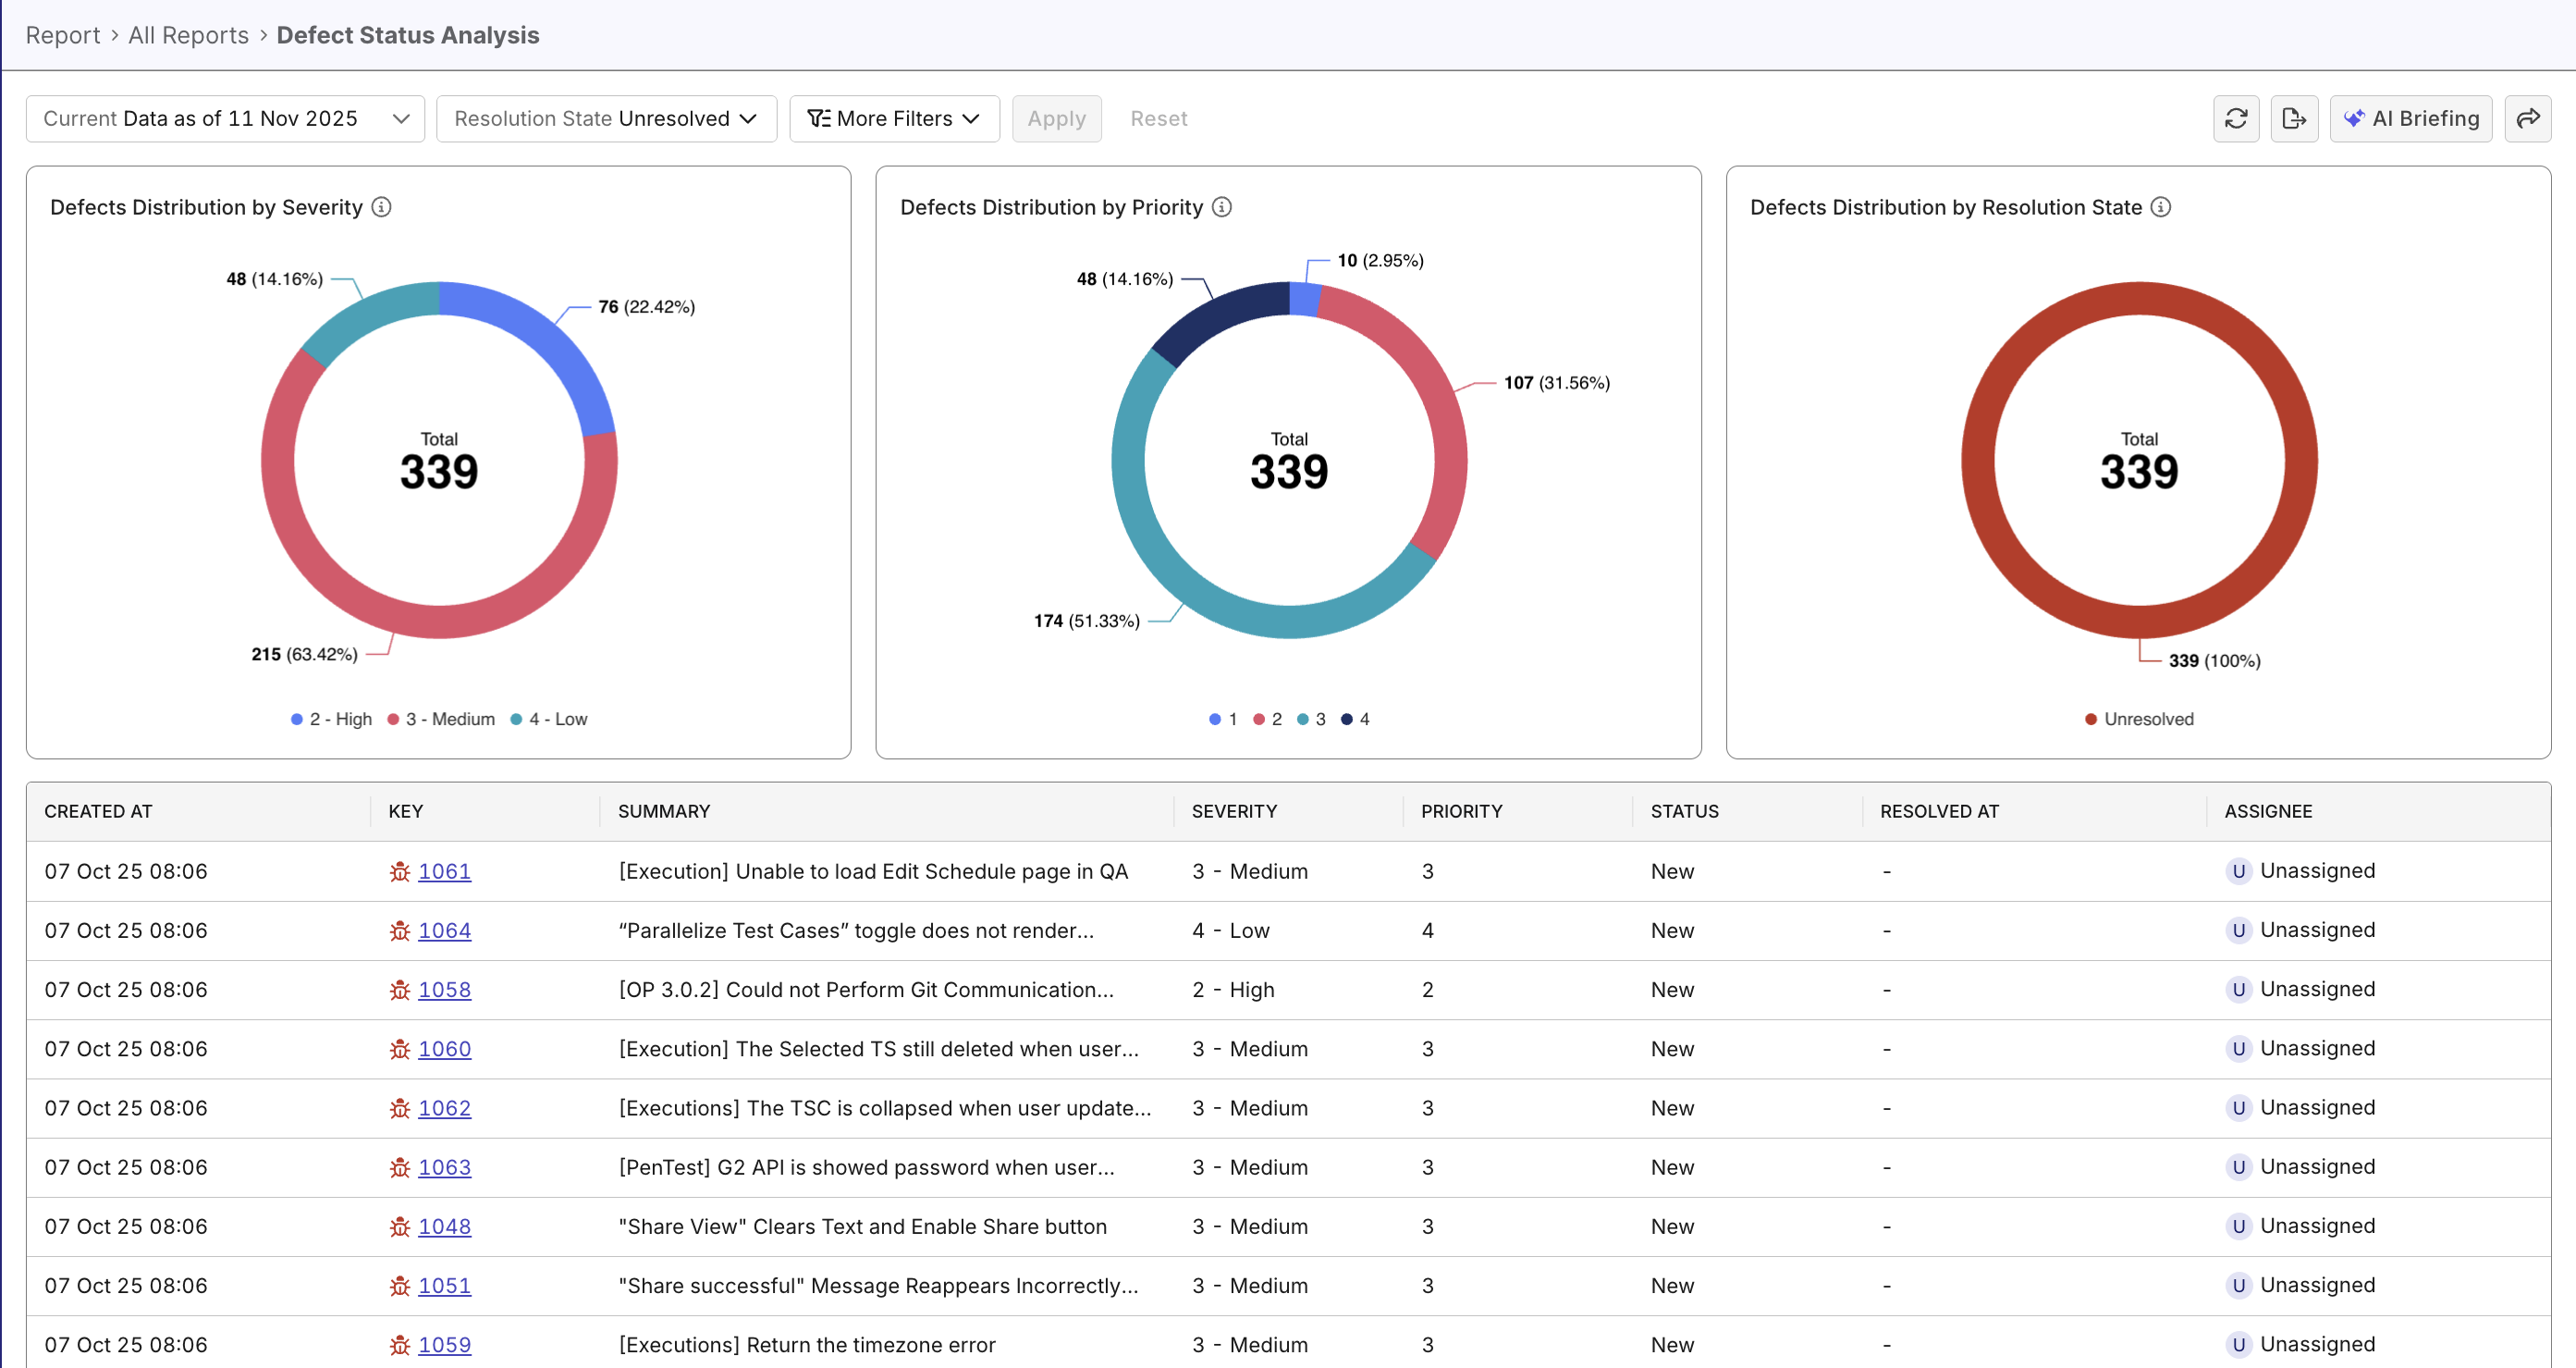
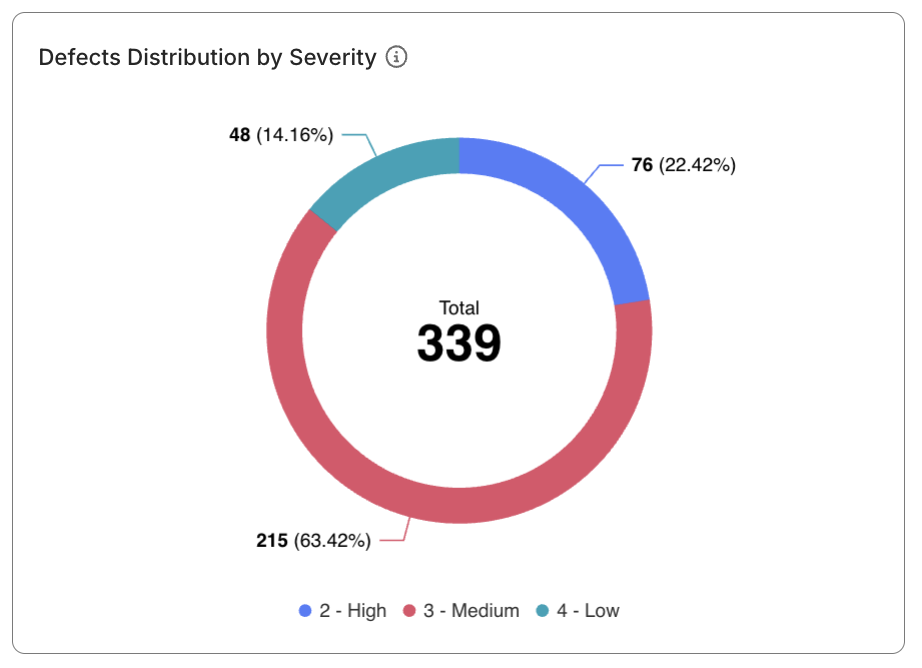
Defects Distribution widgets
- Three donut charts provide visual breakdowns of defect distribution by:
- Severity (Critical, High, Medium, and Low)
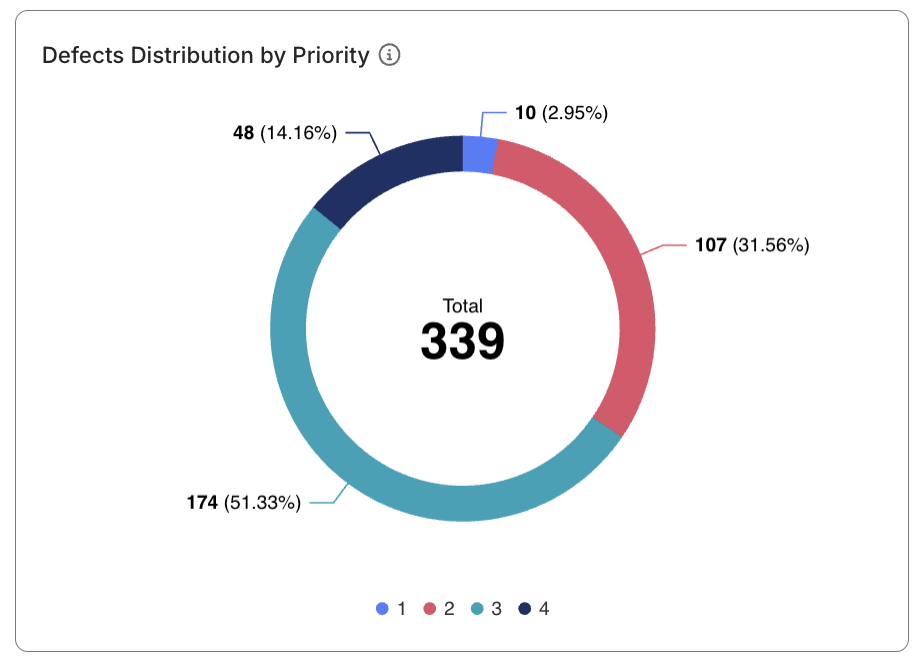
- Priority (1, 2, 3, and 4; 1 is highest)
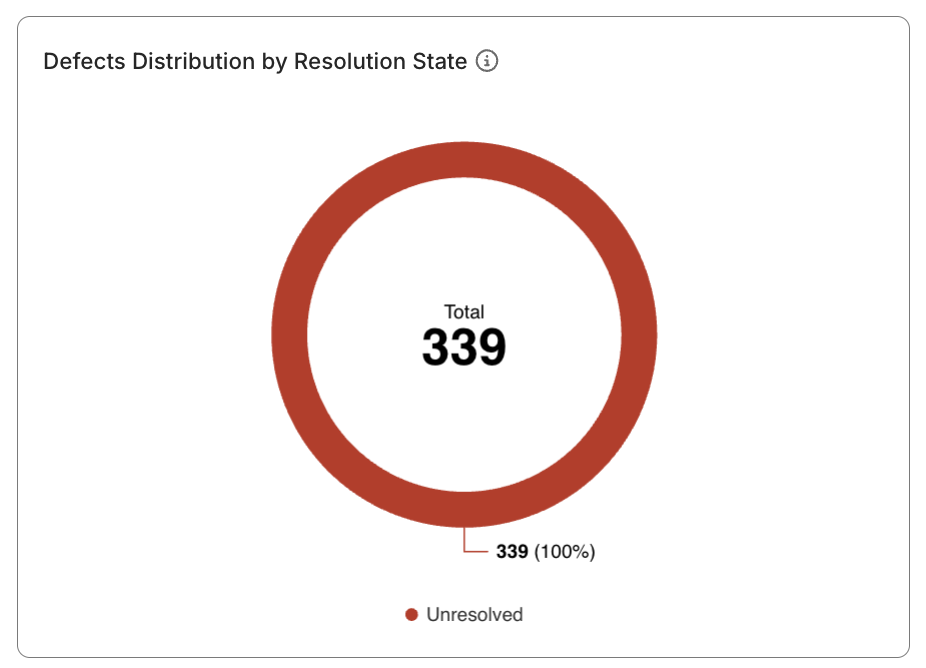
- Resolution State (Unresolved, and Resolved)
note
Defect priority/severity are Katalon True Platform's native terms, not your ALM tool's. Configure mapping between the terms when configuring your ALM tools.
- Each segment displays both percentage and count values. Clicking each segment filters the drilldown table.
- The total defect count (e.g., 339) appears prominently at the center of the view, uniform across three charts, offering quick insight into overall defect volume. Clicking the segment won't affect this count.
Filtering Capabilities
- Scope Filter: Switch between Time Range, Release, or Sprint to adjust your analysis scope.
- Resolution State Filter: Unresolved (default) and Resolved.
- More Filters: Expand to refine by Severity or Priority.
These filters work together dynamically, ensuring that visualizations and tables update immediately when filters are applied.
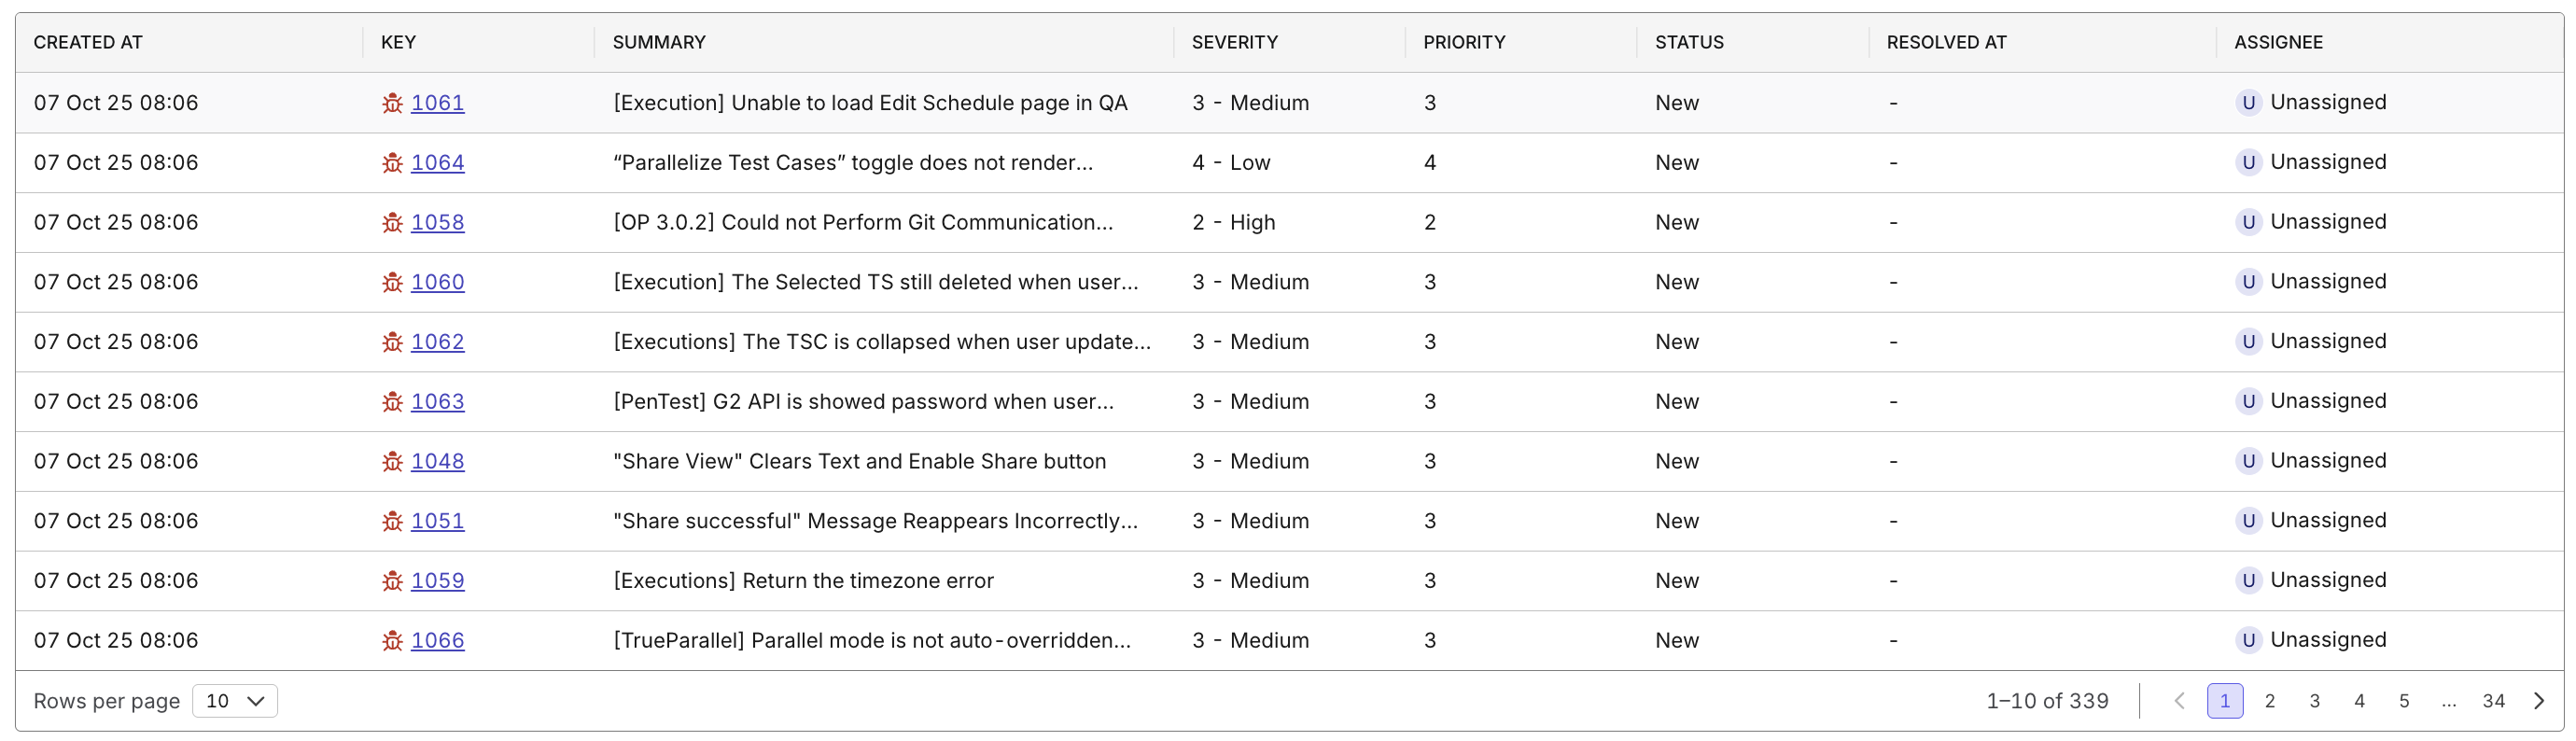
Defect Details Table
- Provides a comprehensive list view of all defects that match your filters.
- Includes columns:
- Created At
- Key (click to navigate to defect details)
- Summary
- Severity
- Priority
- Status
- Resolved At
- Assignee
- Displays 10 rows per page with pagination.