Test Failures Analysis Report
This document lists features of the Test Failures Analysis Report.
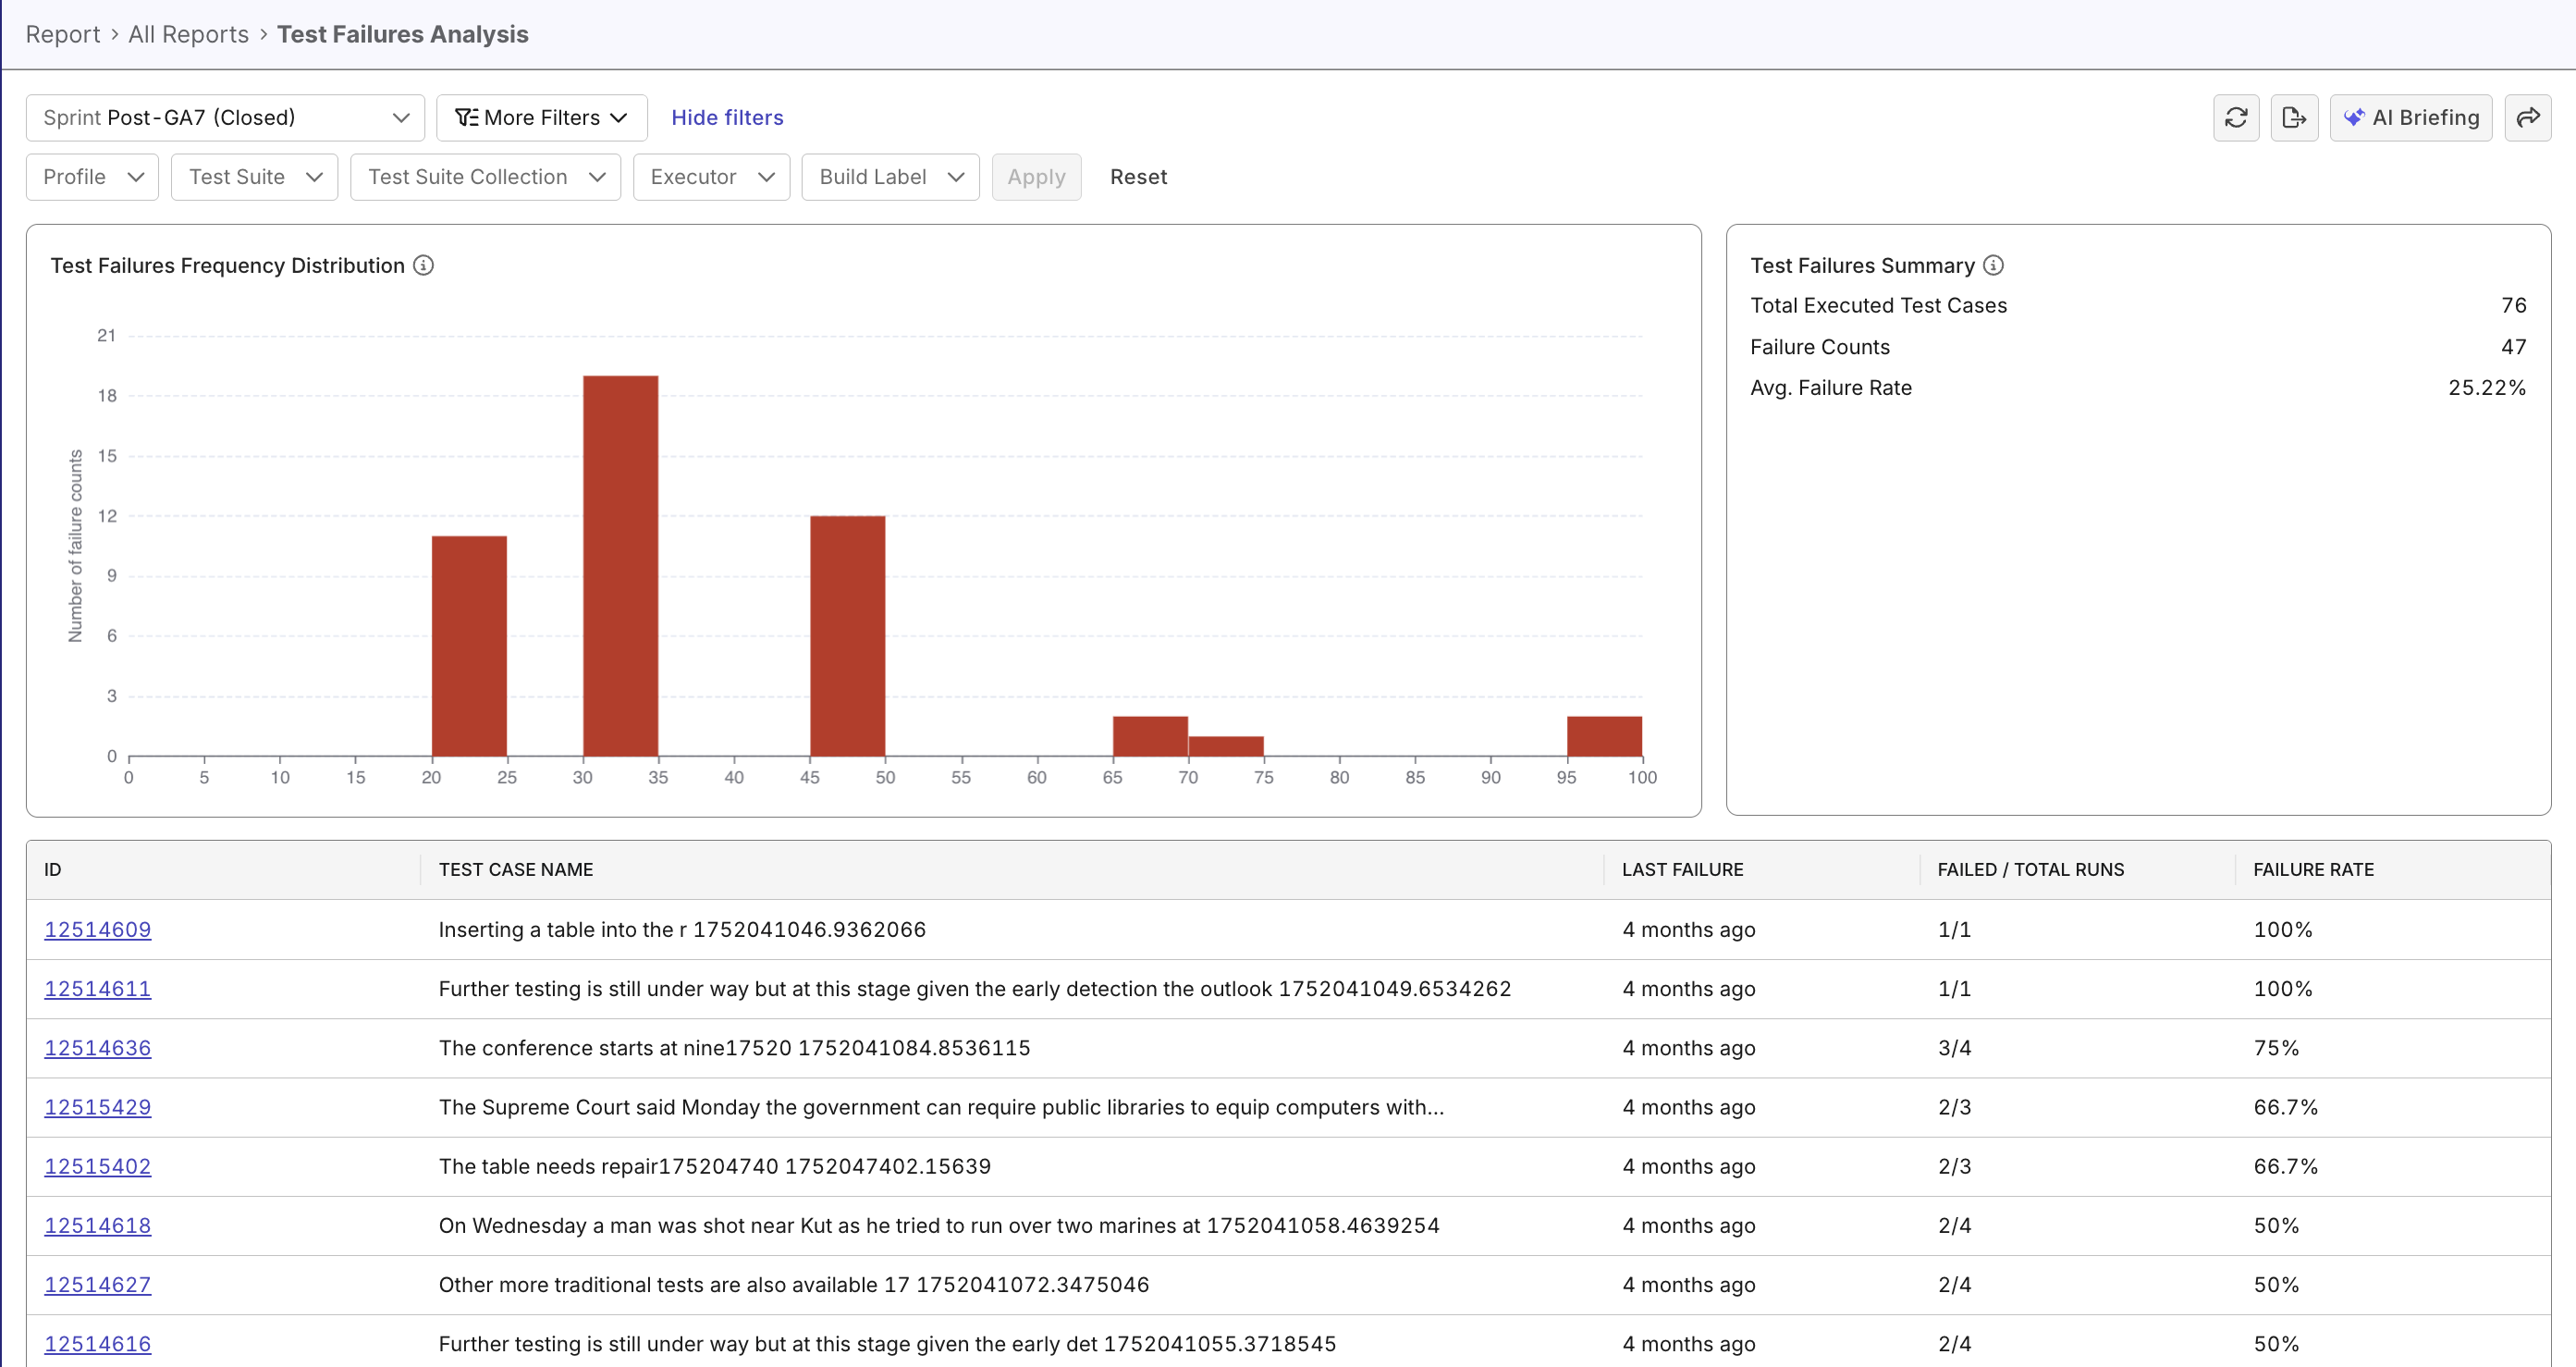
The Test Failures Analysis Report helps QA teams quickly identify unstable or failing test cases, spot recurring failure patterns, and prioritize remediation by highlighting trends and hotspots over time. It provides summary metrics, failure distribution charts, a detailed test-case table, and interactive drill-downs with filters for targeted analysis.
Tutorial: Analyze Failure Patterns
Report Features
Filtering & Scoping
Narrow the dataset to focus on relevant subsets:
- Time Range Selector: Choose from predefined or custom date ranges.
- Context Filters: Profile, Test Suite, Test Suite Collection, Executor, Build Label.
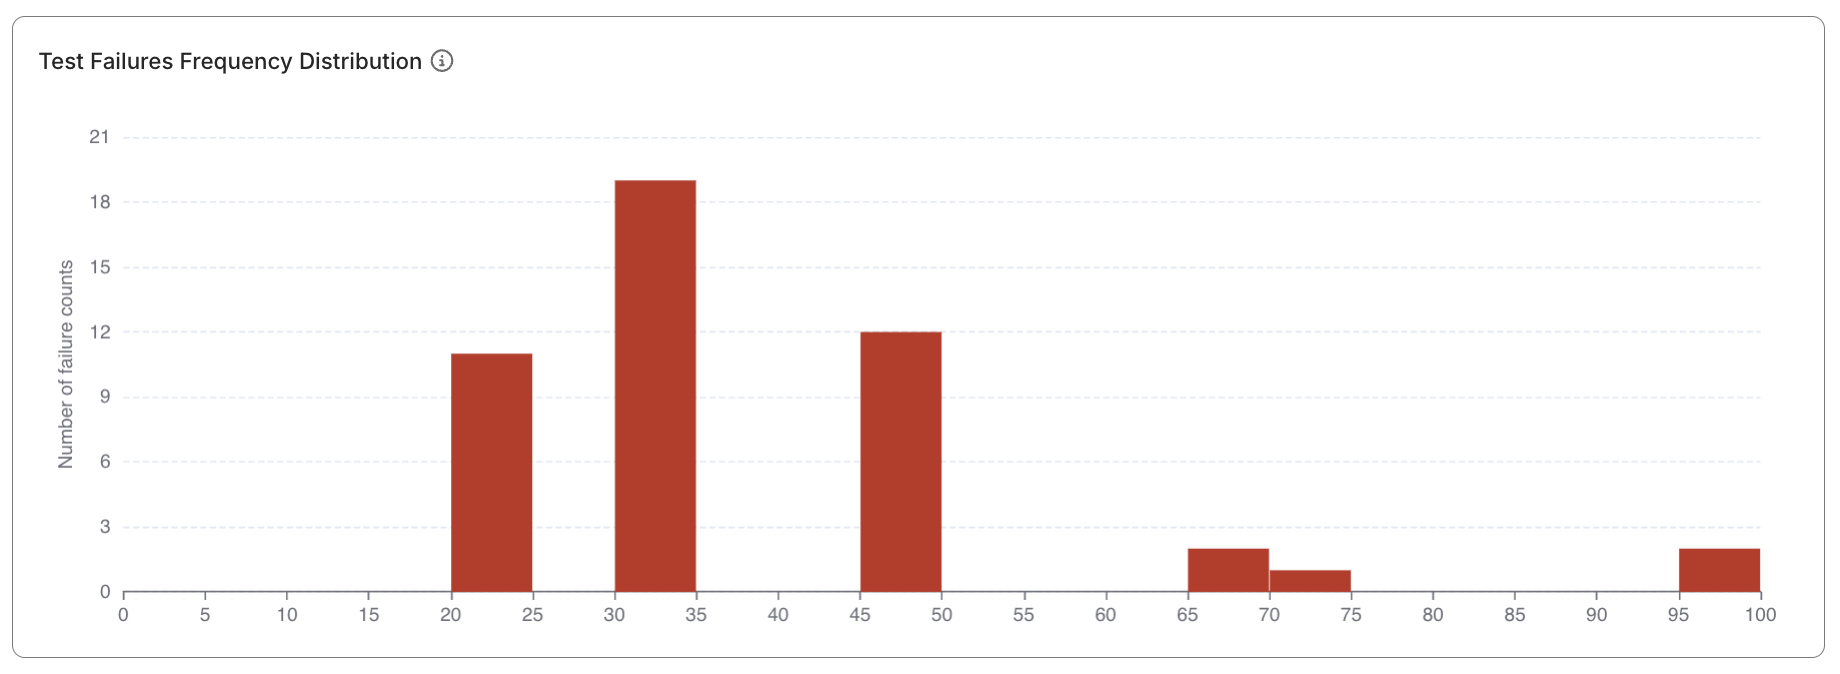
Test Failures Frequency Distribution widget
A histogram showing how test cases distribute across different failure rate ranges:
- Visualizes concentrations of stable, flaky, or broken tests.
- Quickly identifies “hot zones” of unreliability.
- Useful for communicating test quality trends to stakeholders.
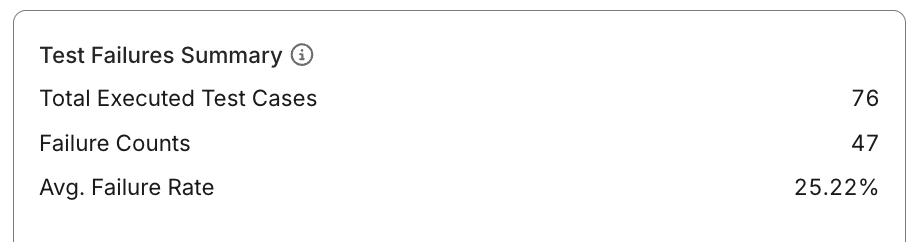
Test Failures Summary widget
Displays top-level indicators summarizing execution activity and failure performance:
- Total Executed Test Cases: Number of distinct test cases run within the selected scope.
- Total Failure Counts: Aggregate number of failed runs across all cases.
- Average Failure Rate: Average percentage of failed runs during the analysis period.
                        Failed Runs
Average Failure Rate = ------------- × 100%
                        Total Runs
This helps QA leads assess whether the test suite is trending toward stability or degradation.
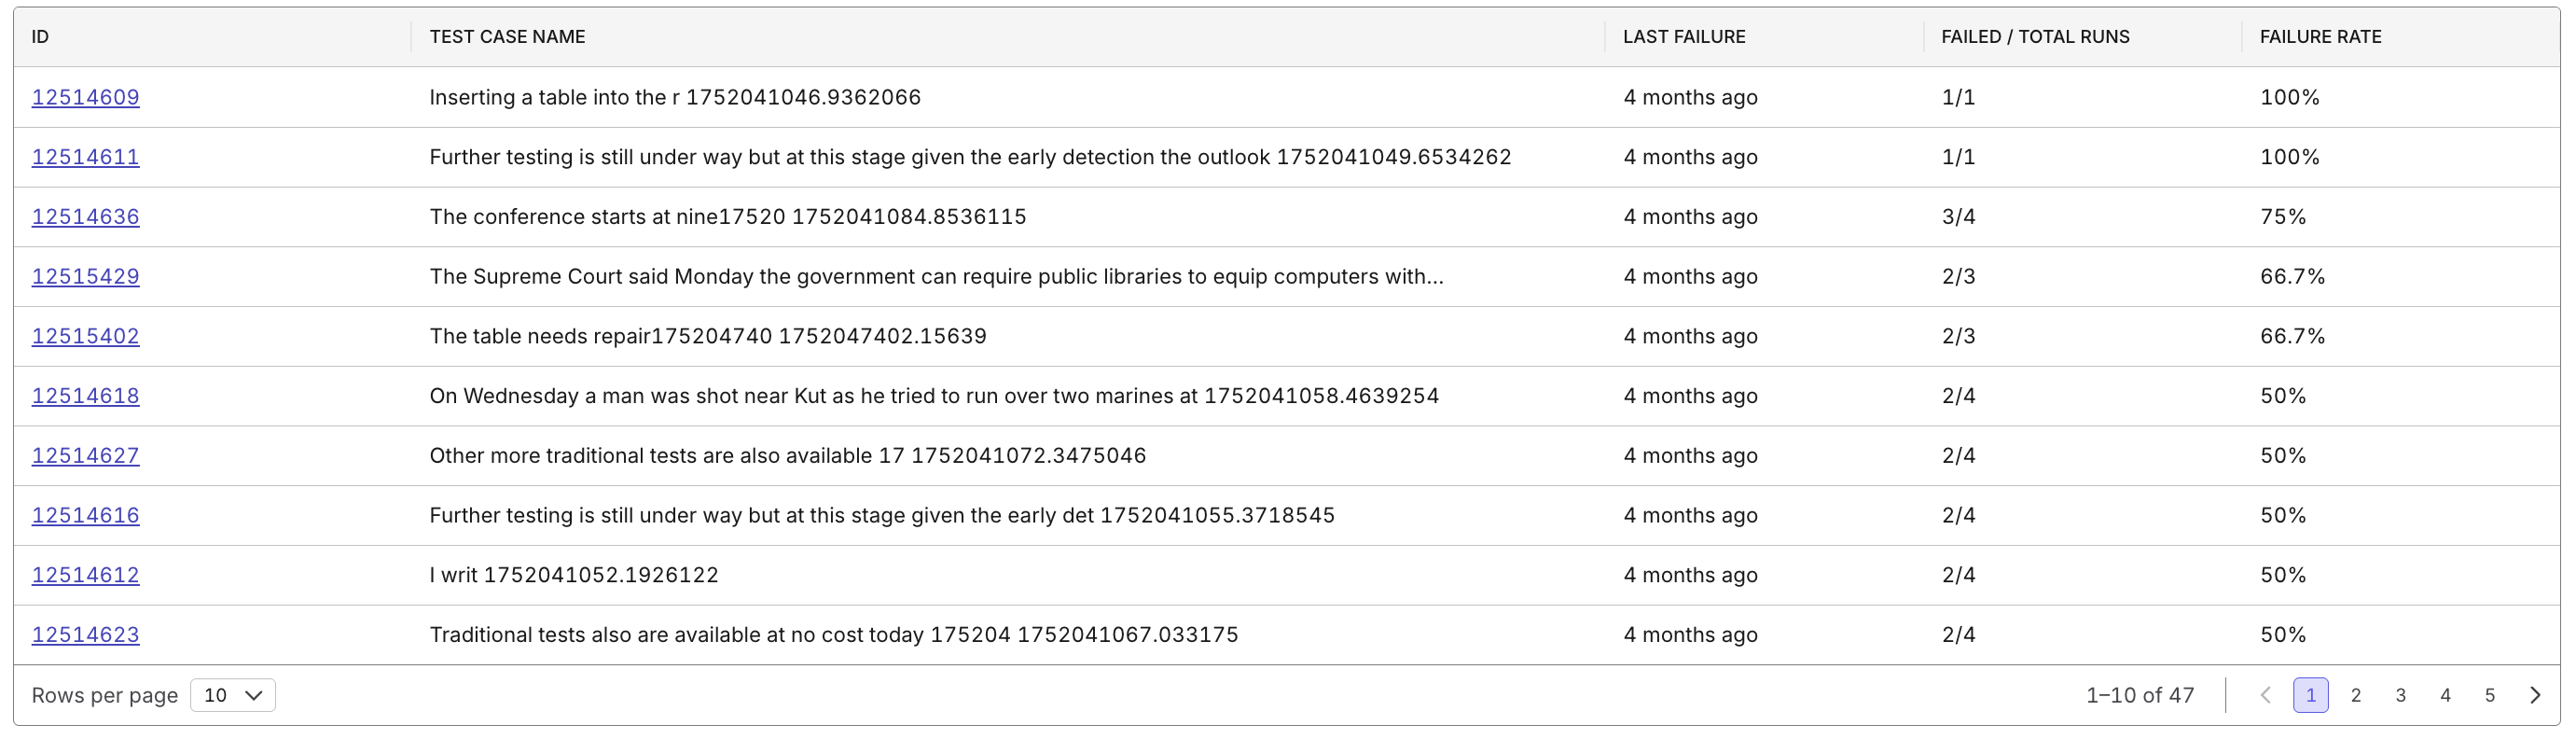
Test Case Details Table
A sortable, filterable table listing all test cases within the report scope:
- Columns include: ID, Name, Last Failure Timestamp, Failed/Total Ratio, and Failure Rate (%).
- Clickable Test Case IDs for drill-down navigation.
- Sorting: Order by failure rate to identify top problem areas first.
Drill-down & Navigation
Interact with report widgets to explore deeper data layers:
- Clicking bars in the histogram shows all tests within that failure rate range.
- Selecting a test case opens its historical run data.
- Enables transition from overview > insight > action.