Defect Status Analysis Report
This shows you what the Defect Status Analysis report is and how to use it.
Prerequisites
- You must possess the Test Lead or Tester role to perform this action. Go to Roles or Permissions for more information or learn how to assign a Project Admin here.
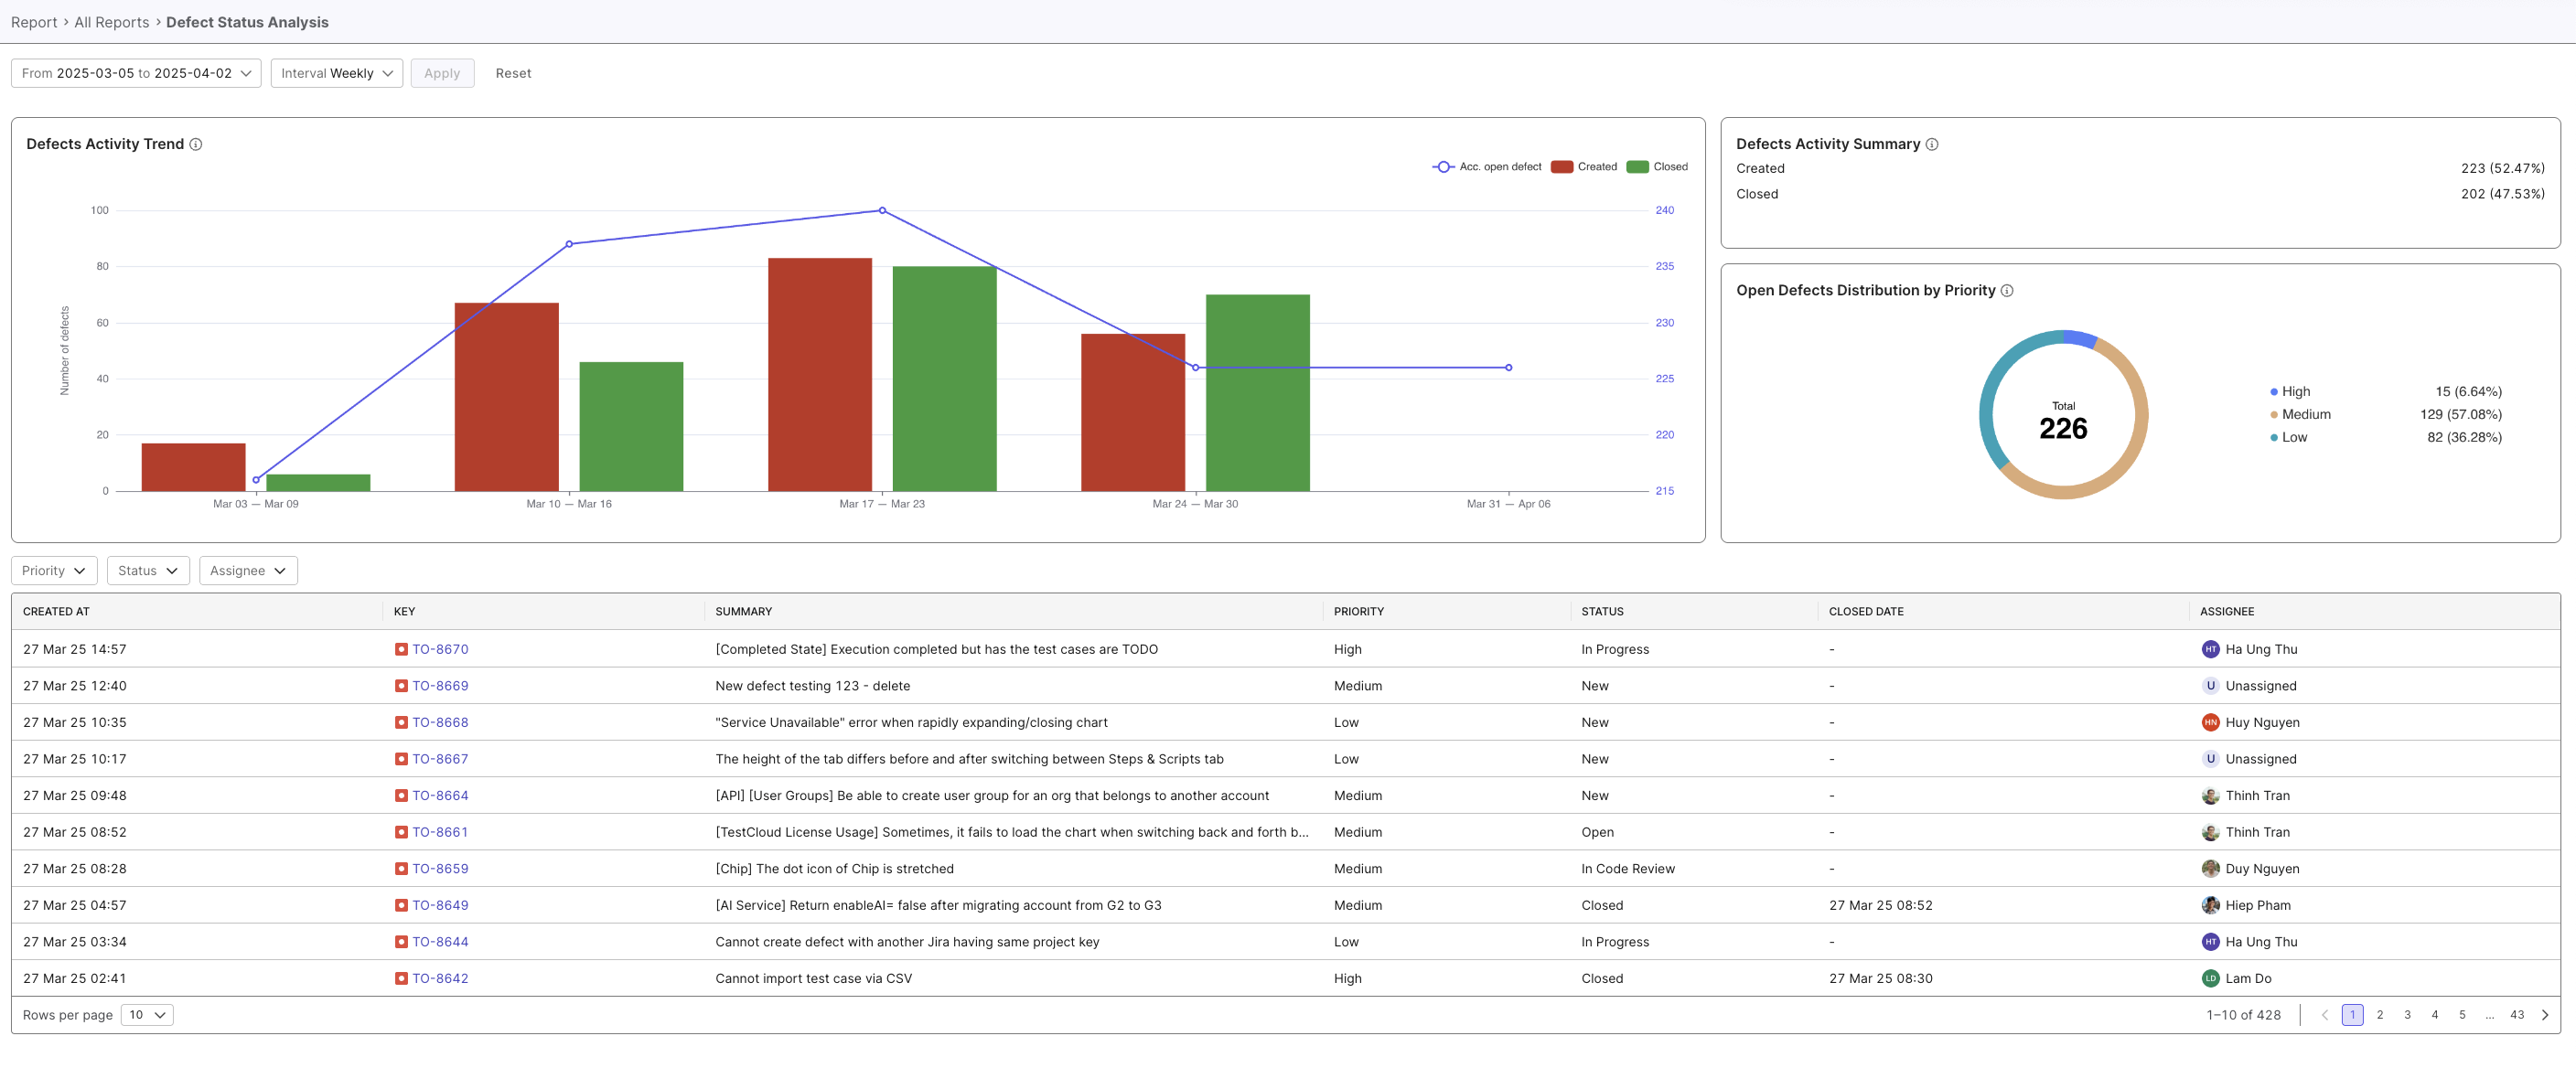
This report combines four powerful visualizations of your test data:
- A dual-axis chart where bars represent daily defect creation and closure counts, while a superimposed line plots the cumulative number of open defects over time.
- A quantitative metrics panel presenting exact counts of created and closed defects.
- A pie chart that segments all currently open defects according to their assigned priority levels (High, Medium, Low).
- A list of defects.
This comprehensive view allows you to track defect trends, or identify patterns. Find it in Reports > All Reports > Defect Status Analysis.
View Total Defect During Period by Status
- Go to Reports > All Reports > Total Defect During Period by Status.
- Enter search parameters to filter for specific data. You can:
- Select a date range
- Select an iteration:
- Select a sprint
- Select a release
- Click Apply to segregate the data or Reset to clear all filters.